
Plan a project with a Gantt chart
Sketch a quick schedule for a small project with the Gantt Chart component: generate it with AI, drag bars to change dates and export it when the plan is settled.
A Gantt chart lays a plan out over time: each task is a bar that starts and ends on a date, so you can see what runs in parallel and what comes next. On a MockFlow board, the Gantt Chart component is a quick way to sketch a schedule for a small project, such as a class project, an event, a campaign or a product launch, right beside the ideas, diagrams and wireframes the plan comes from.
Use it to try out a timeline while you plan, then share it with everyone on the board. When the plan is settled, you can export it to the project tool your team already uses.
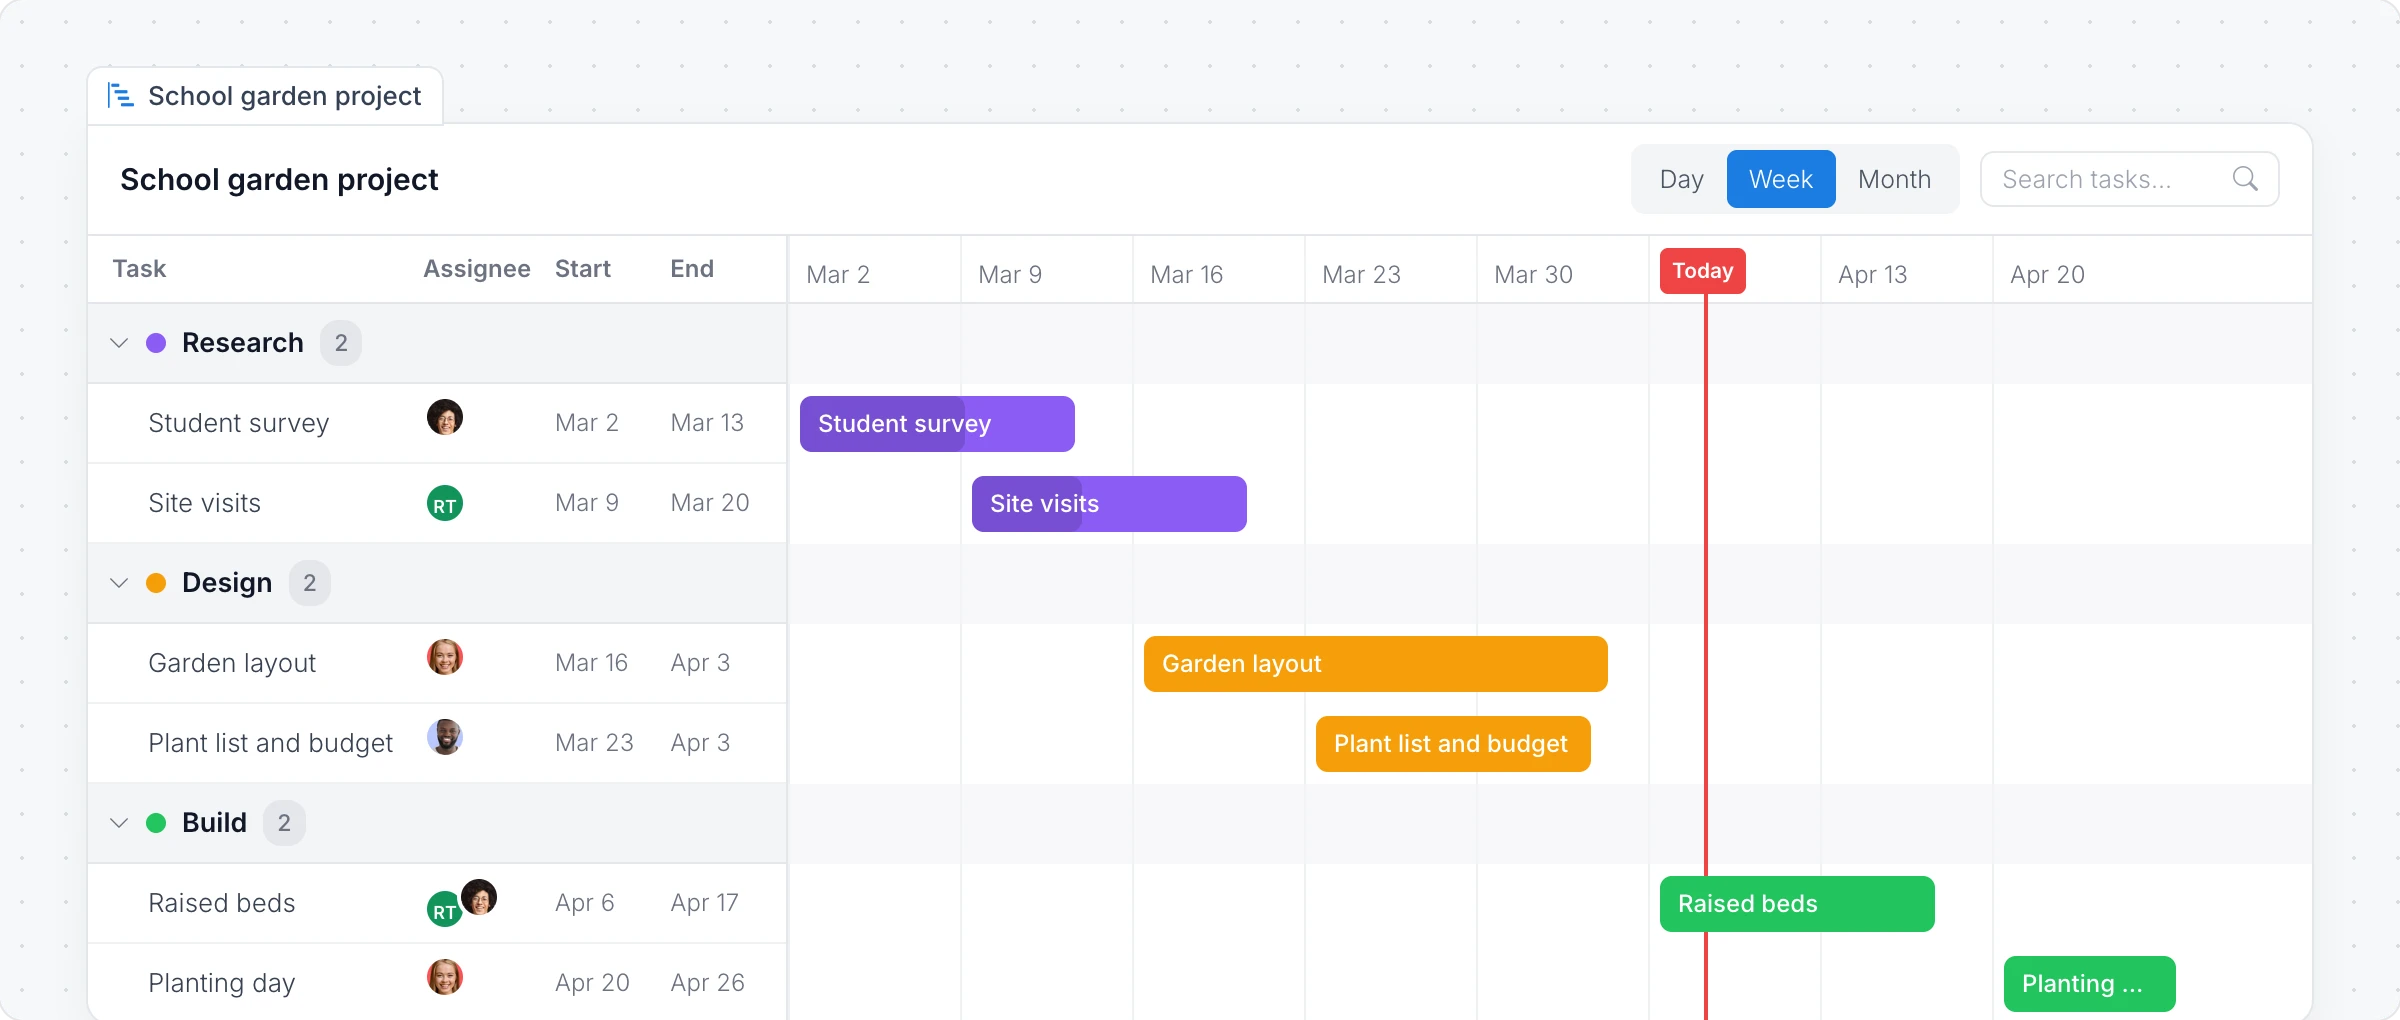
Generate a Gantt chart with AI
Click Add anything (the plus button) in the toolbar at the bottom of the board and choose Gantt Chart.
With the Gantt chart selected, click the AI button on the left of its toolbar and choose Generate new.
Describe the project and its time frame, for example "Eight week plan to build a school garden, from student survey to planting day", and click Generate.
The AI menu also has Modify with AI, to add tasks or shift the plan with a prompt, and Convert to, to turn the schedule into another kind of item, such as a kanban board or a timeline.
Add groups and tasks
Click Interact with Component (the hand button) to work inside the Gantt chart. Tasks sit in groups, such as project phases or teams.
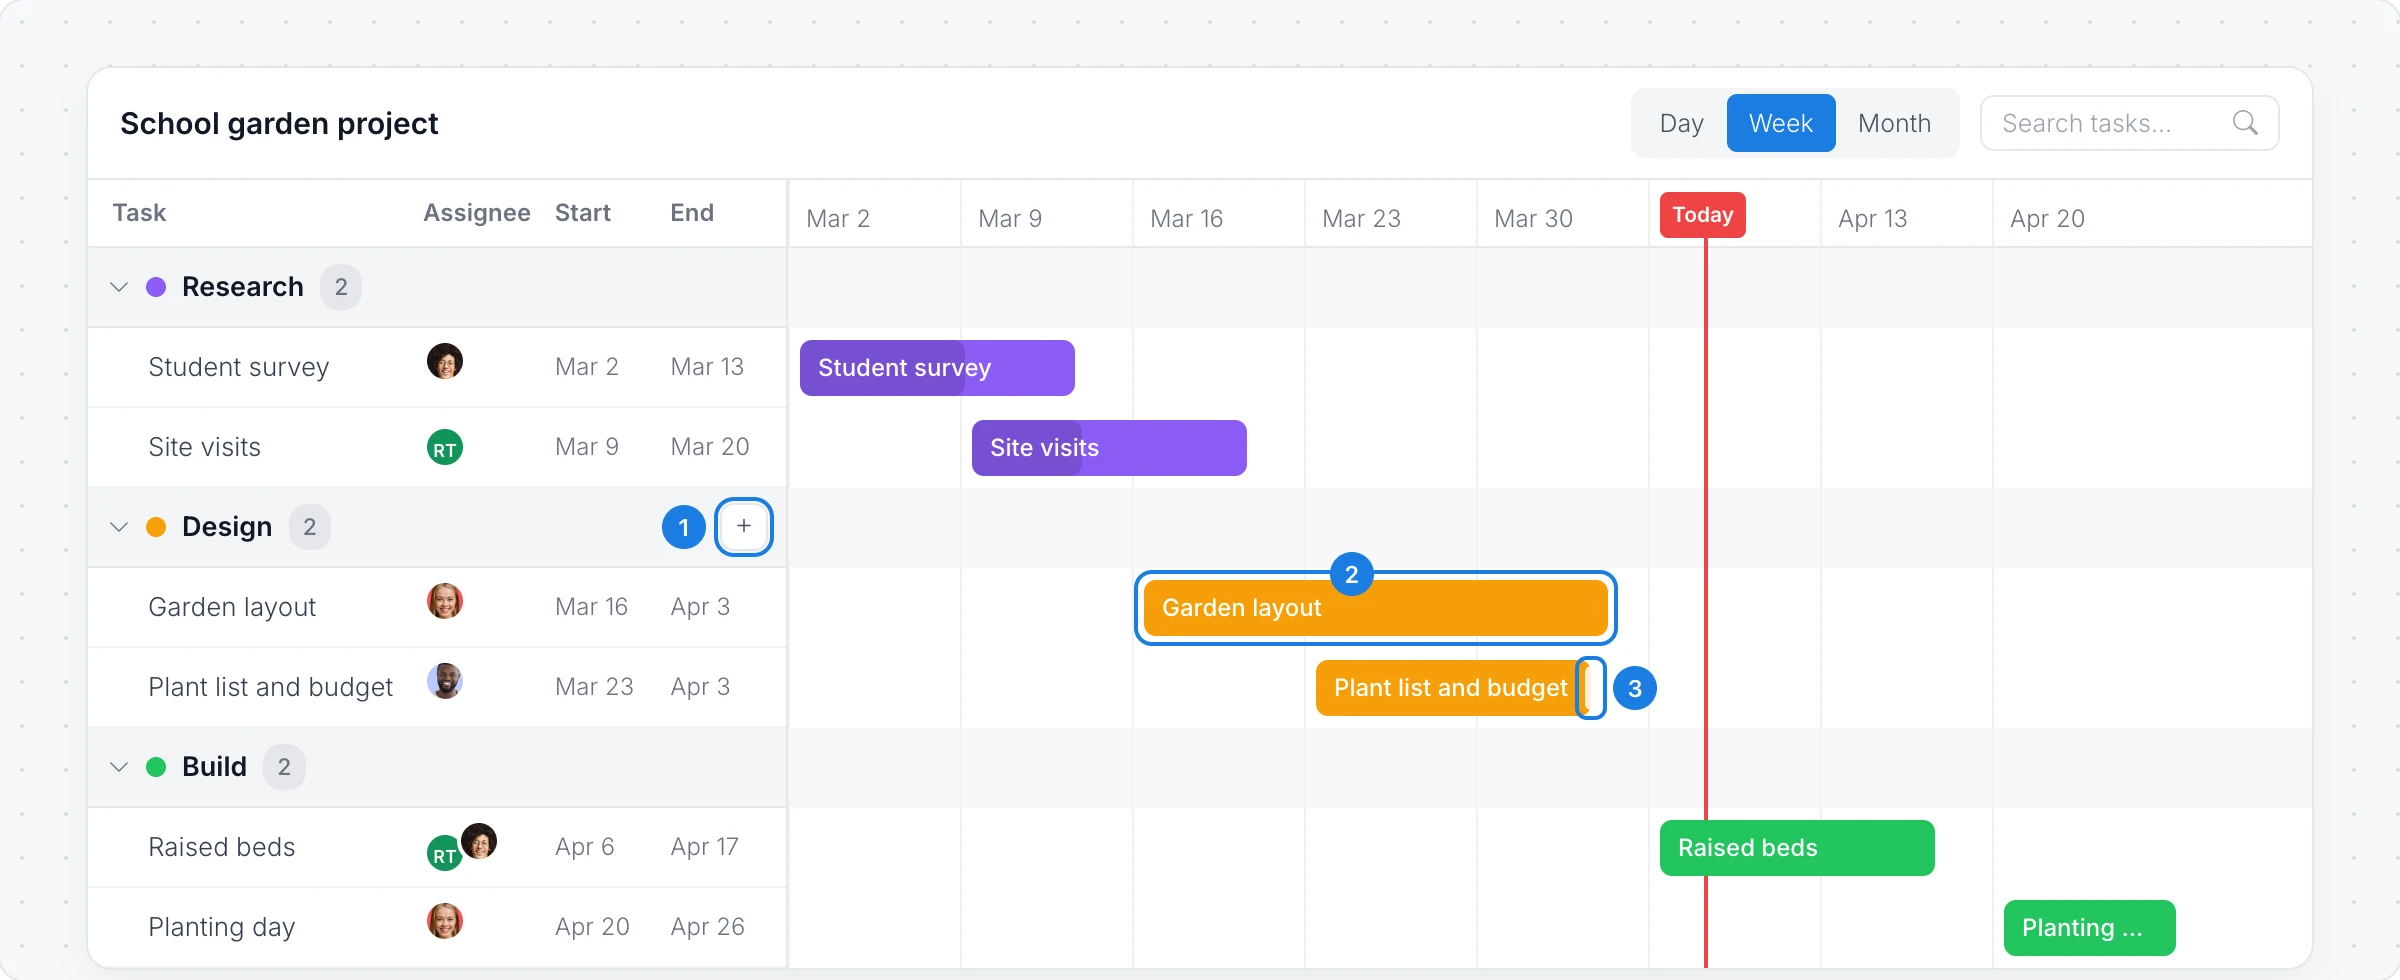
Add task: the plus button on a group row adds a task to that group. Type its name and press Enter.
Move a task: drag a bar along the timeline to change its dates.
Change the length: drag either end of a bar to make the task start earlier or finish later.
Add Group in the toolbar adds a new group. Drag a task to reorder it or move it to another group, and use a group's menu to Rename or Delete Group it.
Assign people and set priority
The left side of the chart lists each task with its Assignee, Start and End date. Click the pencil next to a task to open Task Details, where you set the Priority, the Assignees, the Start Date and End Date, and add comments for the people working on it.
Change the view and colors
Day, Week and Month at the top of the chart change how much time the timeline shows. A red Today line marks the current date.
Search tasks finds a task in a long plan.
Group color in the toolbar sets the color of a group's bars, and the theme switch changes the chart between Light and Dark.
Export a Gantt chart
Choose Export Gantt in the toolbar to download the plan as CSV, to open it in a spreadsheet or import it into another project tool, or as JSON.
The Gantt Chart component is available on every plan. Generating with AI uses AI credits. See MockFlow pricing.