
Color regions on a map
Shade countries, states, continents or world regions by value with the Region Maps component: generate a map with AI or paste your own data, and choose a color scheme.
The Region Maps component shades whole areas of a map by a number, so a pattern across places is easy to see: students by country, sales by state, survey answers by region or the countries a team has visited. It sits on the board next to the tables and plans behind the numbers.
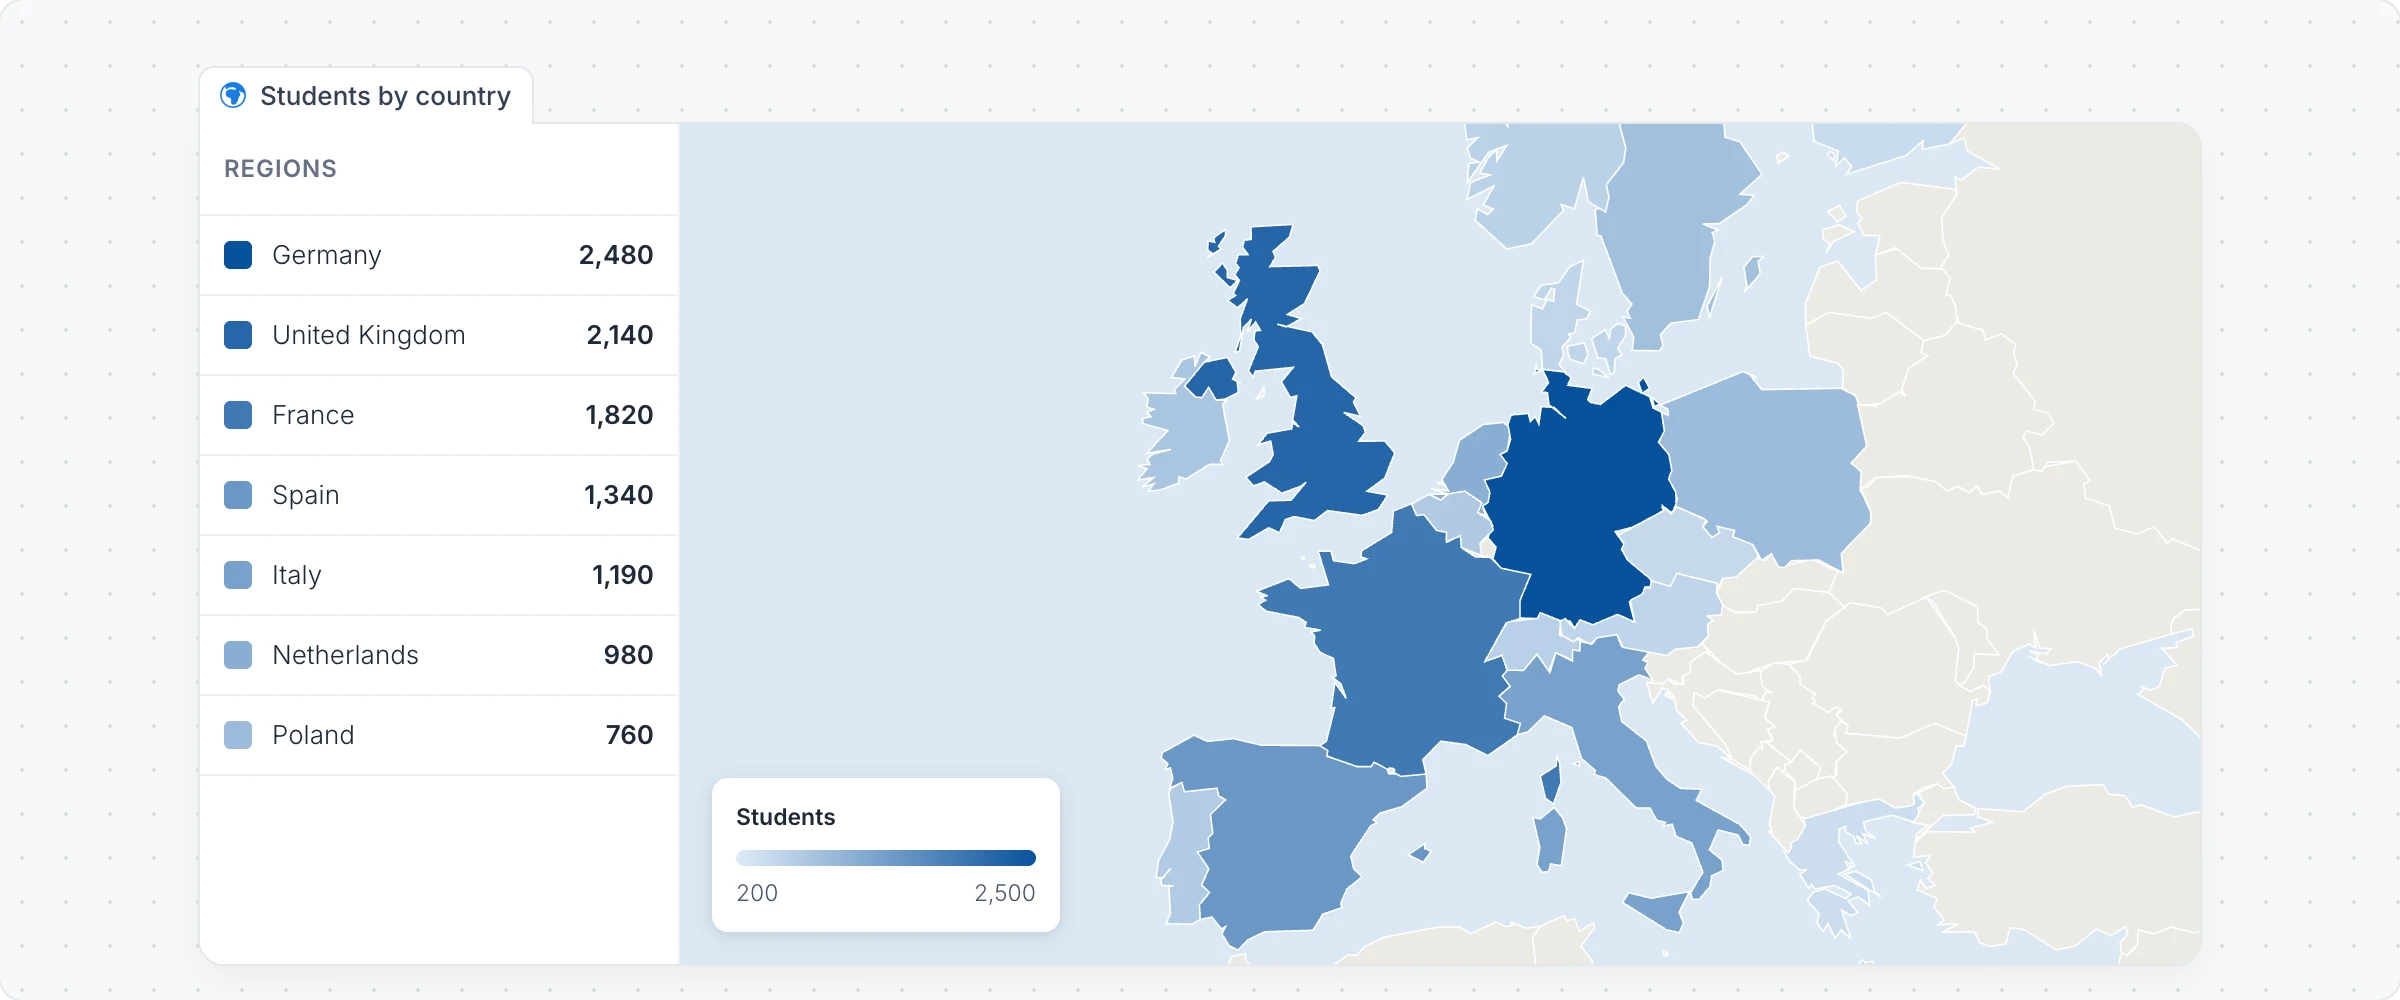
Generate a region map with AI
Click Add anything (the plus button) in the toolbar at the bottom of the board and choose Region Maps.
With the map selected, click Generate with AI in its toolbar and choose Generate new.
Describe the data, for example "Population of each country in South America", and click Generate. Examples offers more ideas.
Modify with AI changes the data or regions with a prompt, and Convert to turns the map into another kind of item, such as a table or a chart.
Add your own region data
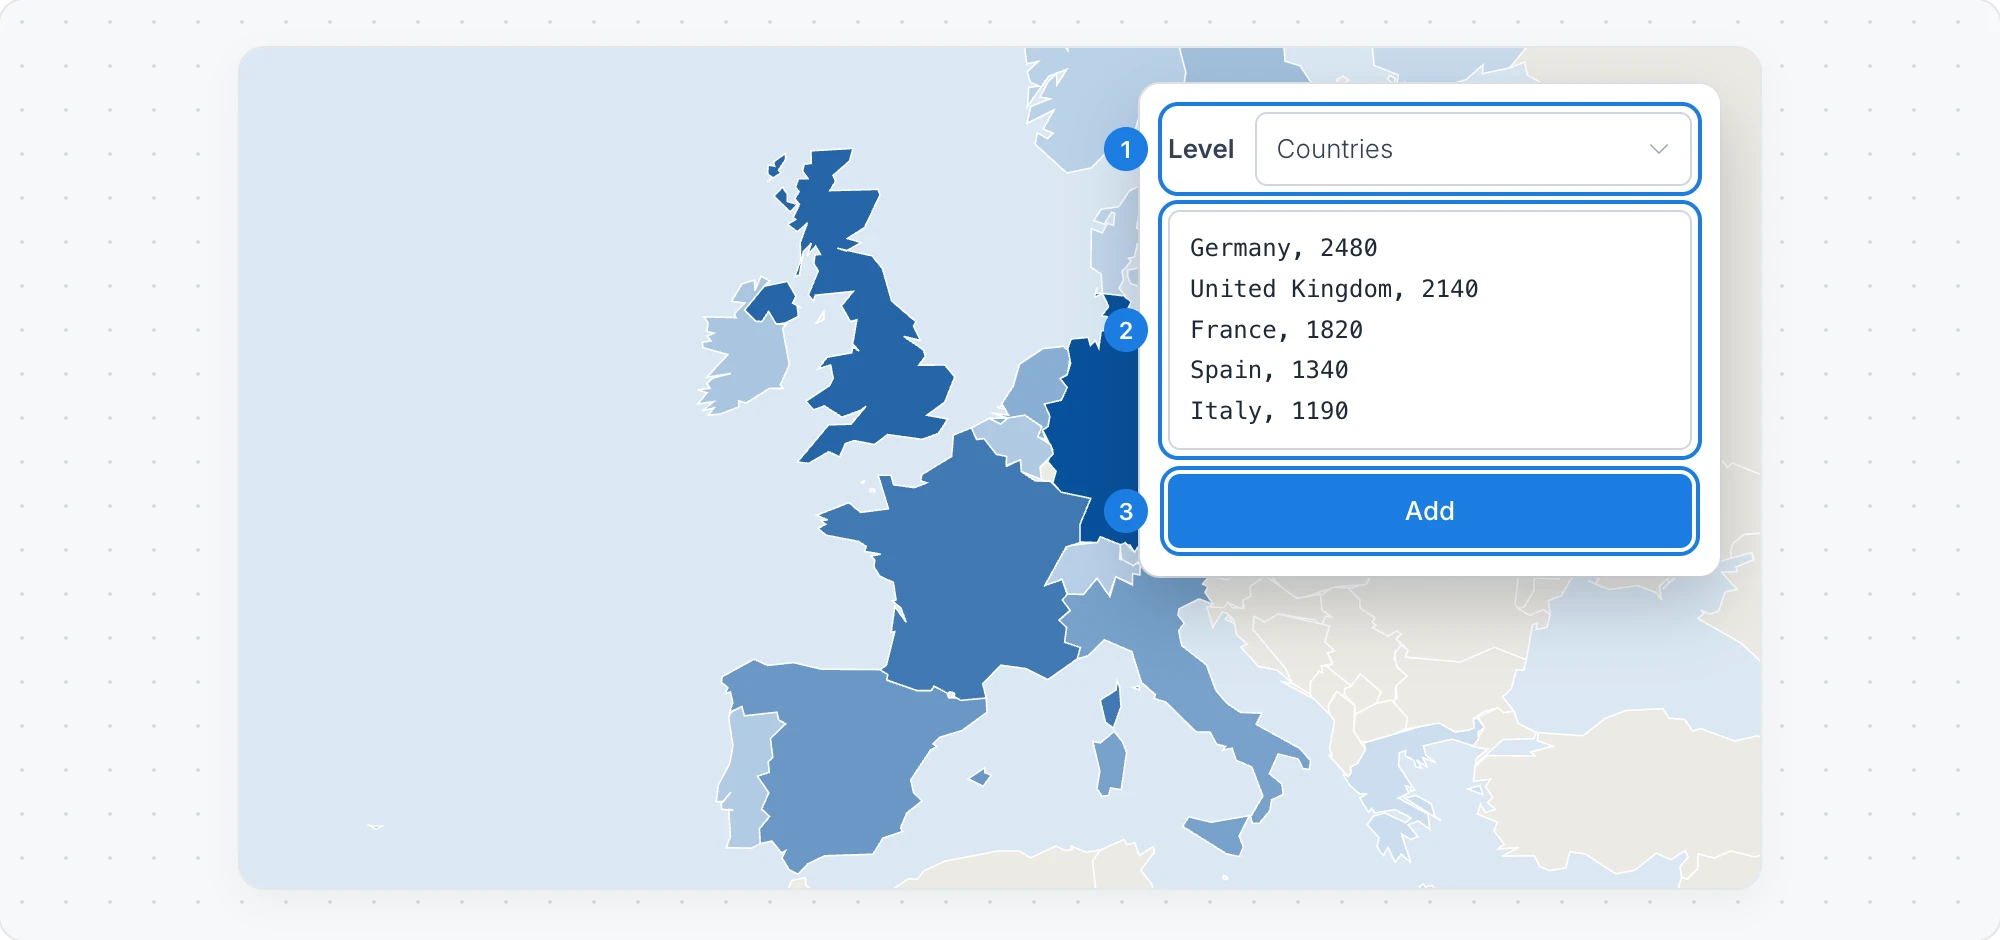
Click Add your own region data in the map's toolbar.
Choose the Level: Countries, States / Provinces, Continents or World regions.
Type or paste one region per line with its value, such as "France, 45".
Click Add. Each region is shaded by its value.
Change the colors and the map
Color palette: shade regions with a scheme such as Blues, Greens, Reds, Viridis or Red-Blue (diverging) for values above and below a midpoint.
Toggle Legend shows the color scale, and Region List lists the regions and their values beside the map.
Change Map Style: a plain map with no detail, or light, dark, black, grayscale and white styles.
Change Map Projection, Toggle Map Labels and Reset Zoom / Fit Regions change how the map is framed.
The Region Maps component is available on every plan. Generating with AI uses AI credits. See MockFlow pricing.