



 Graph Plotter
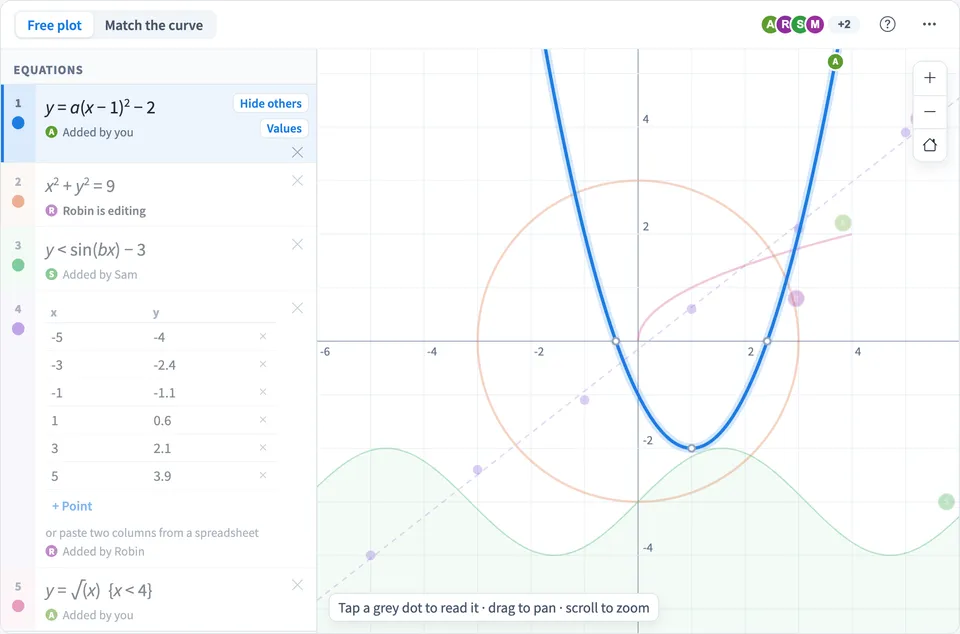
 is an online graphing calculator that the whole board uses together. Type an equation such as y = x² and it draws at once, with the maths shown properly as you type. Circles like x² + y² = 9, shaded inequalities and curves limited to part of the graph all work too.
Use Graph Plotter together on your board.
Every equation shows who added it, any letter becomes a slider you can play, and tapping a grey dot reads the exact value of a root, a turning point or a place where two curves meet. Match the curve turns it into a class race.
It runs on a shared MockFlow board, next to your lesson notes and diagrams. Everyone on the board sees the same graph at once and it stays in sync for all of them.
- One graph for everyone. Everyone on the board adds and edits equations on the same graph. Each row shows who added it, a small avatar marks each curve, and a row says when someone is editing it.
- Equations, shapes and inequalities. Draw y = equations, circles and other shapes, shaded inequalities, and curves limited with a condition in braces.
- Sliders with play. Any letter in an equation gets a slider from minus 5 to 5. Play moves it back and forth and every screen sees the same value.
- Points and best fit. Type or paste points into a small table to plot them with a best-fit line and how well it fits.
- Key points in plain words. Roots, lowest and highest points and crossings are marked as grey dots and described in a list, and a tap pins the exact value.
- Show who did what. Show only one person's equations from the people list, select a curve to highlight it, or hide the others.
- Match the curve race. Ten target curves with hints, a match score as you type and a live leaderboard with match times.
- Zoom, pan and text size. Scroll to zoom, drag to pan, reset the view, and make the text larger from the menu for a shared screen.
How to use Graph Plotter.
Add an equation
Tap Add equation and type, for example y = 2x + 1, then press Enter. Or start from one of the examples. The equation shows in maths form and draws on the graph.
Try shapes and shading
Type x² + y² = 9 for a circle, y 0} to the end of an equation to draw only part of it.
Use sliders
Use any letter, such as y = a sin(x), and a slider for a appears. Drag it, or tap play to move the curve for everyone on the board.
Add points
Tap Add points and type x and y values into the table, or paste two columns from a spreadsheet. A dashed best-fit line and how well it fits appear once there are two points.
Read the key points
Tap a grey dot on a curve to pin its exact value. The Key points list describes where each curve crosses the x-axis, its lowest and highest points, and where curves meet.
Focus on one curve
Tap a row number or a curve to select it. Hide others shows only that curve, and Values lists y for any start and step.
Race to match the curve
Switch to Match the curve. A thick grey target appears, and the first person to type an equation that matches it wins the round. Next curve moves on to the next of ten rounds.
Who uses Graph Plotter.
A maths teacher explaining a function
Play a slider to show how a parabola moves and stretches while the whole class watches the same graph.
A class practising graphs
Run Match the curve as a warm up and see who can turn a picture of a curve into its equation fastest.
Students checking homework together
Each student adds their equation to the shared graph, and the key points show where the answers agree.
A science class with lab data
Paste measurements into a points table and read the best-fit line next to the lab notes on the board.
Add Graph Plotter to your board.
Use on a board opens a new board with Graph Plotter already on it. To add it to a board you already have, follow these steps. Each copy keeps its own data, so a vote on one board never changes another.
Open your board
Open the MockFlow board you want to use it on.
Add it from the Artifact Library
Click Add anything (the plus button) in the toolbar at the bottom of the board, switch to Artifacts and pick Graph Plotter under Utilities. Adding it does not use AI credits.
Use it together
Click Interact with Component (the hand button), or switch the board to Play mode. Everyone on the board uses the same app, and Reset shared data clears it for the next session.








 Brainstorm with MockFlow MCP


