



 Opinion Axis Plot
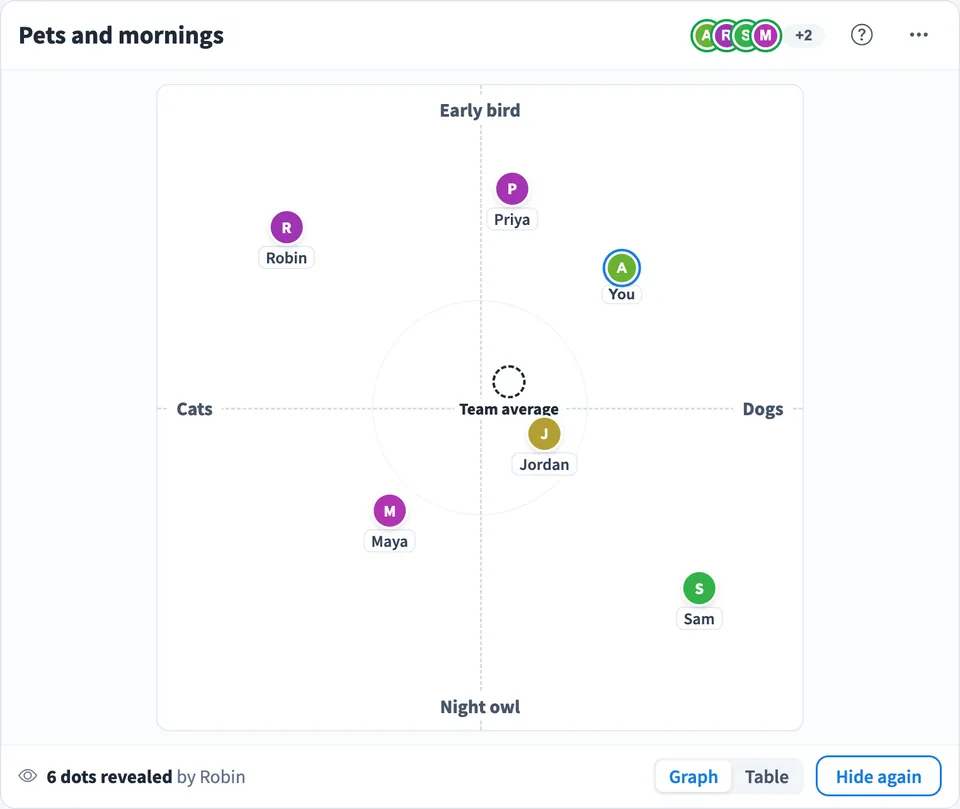
 is a team alignment chart for icebreakers, retros and quick opinion checks. Set a question and name both ends of two axes, such as Cats or Dogs across and Early bird or Night owl up and down, and everyone on the board drops their own avatar where they stand.
Use Opinion Axis Plot together on your board.
Dots stay hidden while people place them, so nobody follows the crowd. When the team is ready, Reveal all shows every dot at once with a ring at the team average, and the Table view turns the same answers into plain words.
It runs on a shared MockFlow board, next to your notes and plans. Everyone on the board sees the same plot at once and it stays in sync for all of them.
- Hidden until the reveal. Each person sees only their own dot while placing, so answers are honest. Reveal all shows everyone's dot together.
- Any two axes. Name all four ends yourself for any this or that question, or pick a ready pair to start quickly.
- Team average. After the reveal a dashed ring shows where the team sits on average, so you can see the overall lean at a glance.
- Plain words table. The Table view reads every answer as words with how strongly each person leans, plus a summary of the split on each axis and the person most different from the group.
- Drag, tap or keys. Place your avatar by tapping, dragging or with the arrow keys, and move it again after the reveal if you change your mind.
- Text size. Make the text larger or smaller from the menu, so the plot reads well on a shared screen.
How to use Opinion Axis Plot.
Set up the plot
Type a question and name the left, right, top and bottom ends of the axes, or start from one of the ready pairs such as Coffee or Tea and Introvert or Extrovert. Tap Start round.
Drop your dot
Tap Place my dot, tap anywhere on the plot, or drag your avatar to where you stand. The arrow keys nudge it. You only see your own dot and a count of how many people have placed.
Reveal all
When everyone has placed, tap Reveal all. Every dot appears at once with names, and a dashed ring marks the team average. Hide again goes back to placing.
Read the table
Switch to Table to see each person's answer in words, such as Dogs, strongly or In the middle, how the team split on each axis, the team average and who is furthest from the group.
Ask the next question
Open the menu and choose Next question to start a fresh round with the same axes or new ones. Edit question fixes a typo without clearing the dots.
Who uses Opinion Axis Plot.
A remote team starting a meeting
Ask a light this or that question as an icebreaker and talk about the surprises when the dots are revealed.
A team running a retro
Plot how the sprint felt on two axes, such as calm or stressful and slow or fast, and discuss the outliers.
A workshop facilitator
Check where the room stands on two questions before a decision, without anyone being swayed by the first answers.
A teacher getting to know a class
Run a quick alignment chart on the first day and use the table to start a conversation.
Add Opinion Axis Plot to your board.
Use on a board opens a new board with Opinion Axis Plot already on it. To add it to a board you already have, follow these steps. Each copy keeps its own data, so a vote on one board never changes another.
Open your board
Open the MockFlow board you want to use it on.
Add it from the Artifact Library
Click Add anything (the plus button) in the toolbar at the bottom of the board, switch to Artifacts and pick Opinion Axis Plot under Voting & Polls. Adding it does not use AI credits.
Use it together
Click Interact with Component (the hand button), or switch the board to Play mode. Everyone on the board uses the same app, and Reset shared data clears it for the next session.










 Brainstorm with MockFlow MCP


