Process Mapping Explained: 7 Types, Examples, Uses, and Best Practices
An approval sits untouched because no one knows who owns it. A customer request moves between departments without resolution. A product launch stalls after one team completes its work. Problems like these often lead operations managers and project leads to process mapping.
A process map places the complete workflow on one visual canvas. Each task appears with its owner and decision path, making delays and repeated work easier to locate. The process mapping examples in this guide compare seven map types, explain where each works best, and show how to create reliable workflows with IdeaBoard.
What is process mapping and why is it important for businesses?
Process mapping is a visual method of documenting how a process works from beginning to end. It represents process steps, decisions, responsibilities, inputs, and outputs to help teams understand, analyze, and improve workflows.
A process map gives teams a clear view of how work moves through a business. It shows:
What a process map captures | Why it matters |
Activities and tasks | Helps teams understand every action required to complete a workflow |
Sequence of steps | Shows how work moves from one stage to the next |
Decision points | Highlights approvals, conditions, and paths that affect the workflow |
Roles and responsibilities | Clarifies which teams or individuals own each step |
Inputs | Identifies information, resources, or requirements needed to start the process |
Outputs | Defines the final result produced by the workflow |
By making workflows visible, process maps help teams understand how work happens and where improvements are needed.
Key benefits include:
- Finding inefficiencies: Identify unnecessary steps, repeated work, approval delays, and process gaps.
- Standardizing workflows: Create SOPs, support training, and maintain consistent execution. For instance, reusable AI recipes give recurring process-mapping work a consistent starting structure.
- Improving collaboration: The right process mapping tools give teams a shared place to review responsibilities, handoffs, and dependencies as the workflow changes.
- Supporting improvement: Analyze current workflows, redesign processes, and track changes over time.
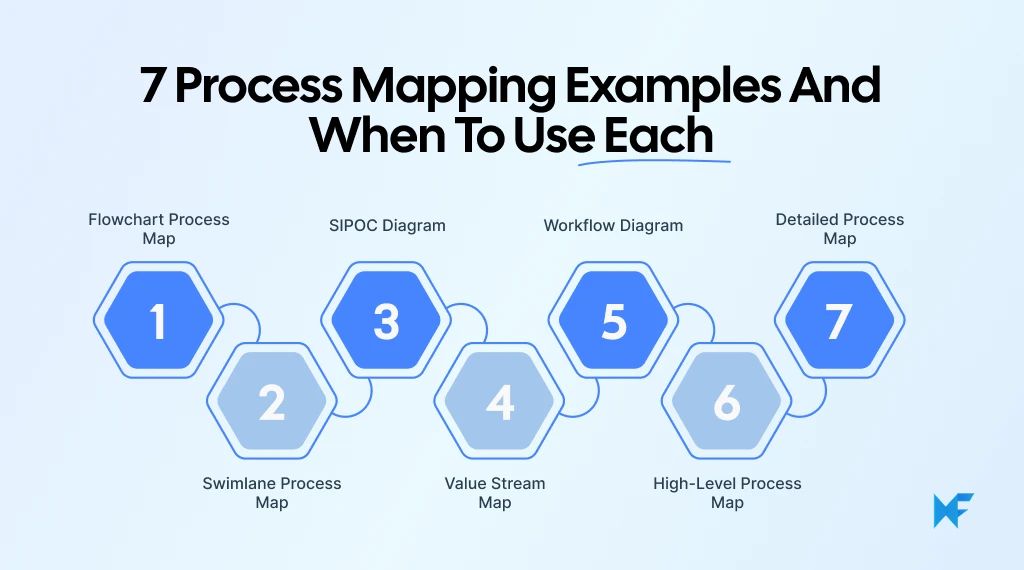
7 process mapping examples and when to use each
The right process map depends on what you need to see, clarify, or improve in a workflow. Some maps are better for understanding the overall sequence, while others give you the detail needed to examine ownership or identify where work slows down.
If you already have a process in mind, a template can make the starting point easier. For example, a service request management process map helps you visualize how a request moves through the workflow and where decisions affect what happens next. You can adapt the map to reflect your own process before reviewing it with the people involved.
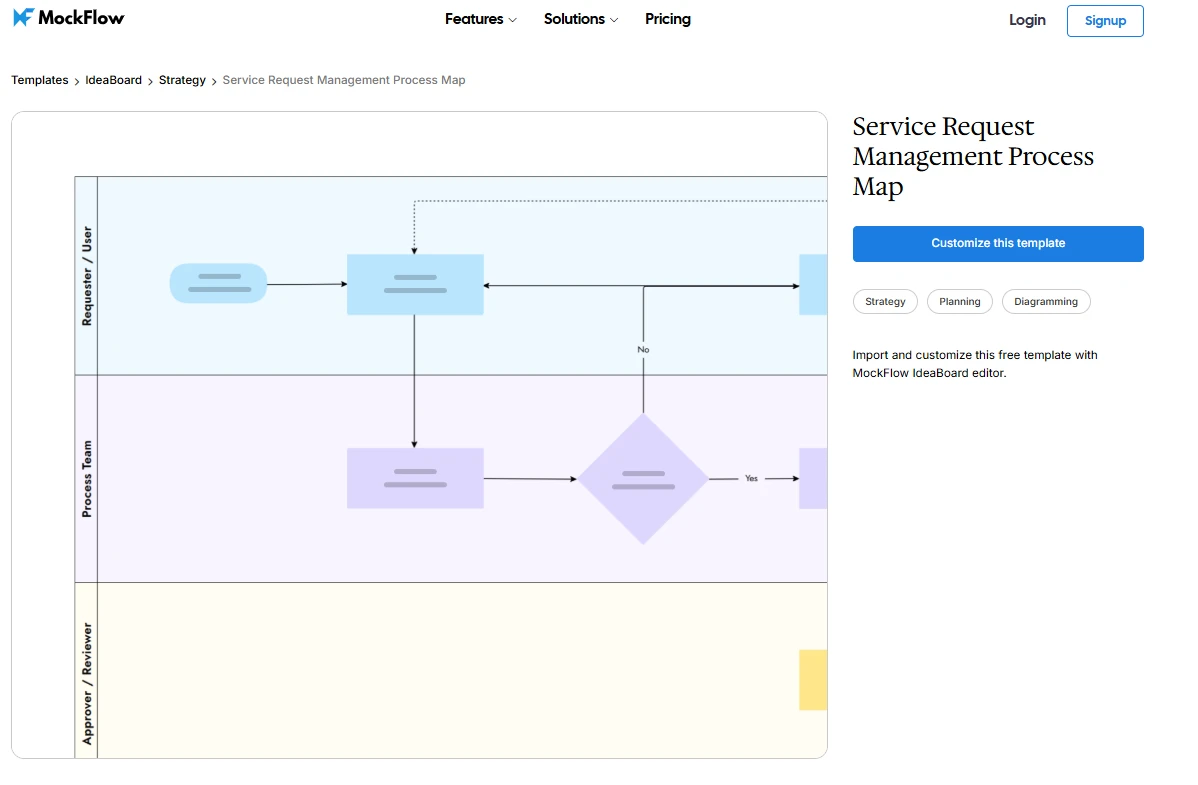
Customize this service request management process map
1. Flowchart process map
A flowchart process map visualizes a workflow using connected steps and decisions. It uses recognizable flowchart symbols to represent actions, decisions, inputs, outputs, and connections from start to finish.
Flowcharts typically include:
- Start and end points: Define where the process begins and ends.
- Process steps: Show tasks or activities completed during the workflow.
- Decision points: Highlight choices that change the process path.
- Arrows: Show the direction of workflow movement.
Flowcharts are among the most familiar process mapping examples because they clearly represent straightforward workflows with limited stakeholders and predictable sequences.
Common examples include:
- Customer refund approval process
- Employee leave request workflow
- Purchase approval process
For example, an operations workflow flowchart can show how a request moves from submission to review, approval, and completion. This gives teams a clear view of responsibilities and helps uncover workflow gaps.
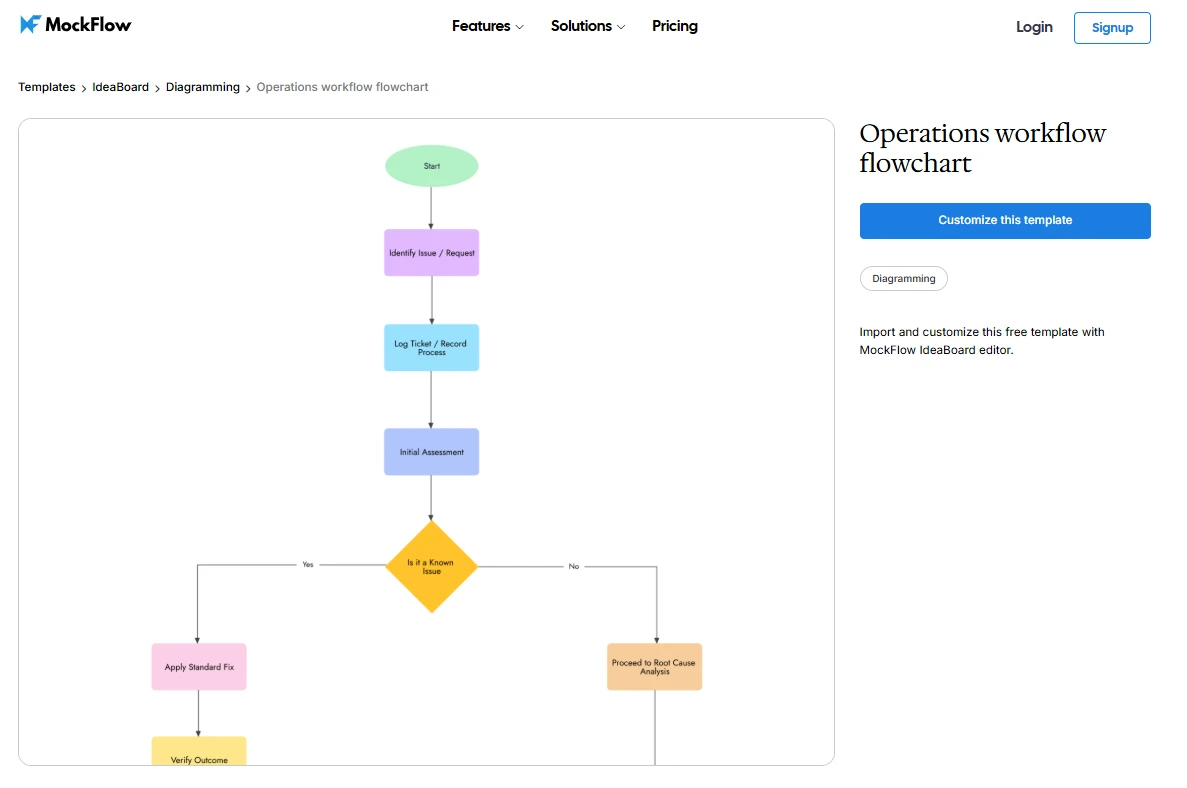
Customize this operations workflow flowchart template in IdeaBoard
2. Swimlane process map
A swimlane process map separates a workflow into lanes for different teams, roles, or departments. This structure makes ownership, handoffs, dependencies, and cross-functional delays easier to identify.
Swimlane maps help teams identify:
- Ownership gaps between steps
- Communication issues during handoffs
- Delays caused by approvals or dependencies
They are especially useful for cross-functional processes where multiple teams contribute to a shared outcome.
Common examples include:
- Employee onboarding: Shows coordination between HR, IT, and managers.
- Customer onboarding: Maps handoffs between sales and customer success.
- Product launch workflow: Tracks collaboration between marketing, product, and engineering.
For example, a product launch swimlane map can show which team owns each stage of the release, helping everyone understand dependencies and avoid missed handoffs.
3. SIPOC diagram
A SIPOC diagram gives teams a high-level view of a process before creating a detailed process map. It helps define process boundaries and identify the stakeholders, resources, and outcomes involved.
SIPOC covers five elements:
- Suppliers: Sources that provide inputs for the process
- Inputs: Resources or information required
- Process: The main workflow stages
- Outputs: Results produced by the process
- Customers: People or groups receiving the outcome
Teams often create a SIPOC diagram during early process analysis to align stakeholders, clarify boundaries, and identify which parts of the workflow need more detailed investigation.
Common use cases include:
- New product development
- Customer service improvement
- Manufacturing quality processes
When teams need to align around a process before documenting detailed workflows, a SIPOC analysis template provides a structured way to organize suppliers, inputs, process stages, outputs, and customers in one place.
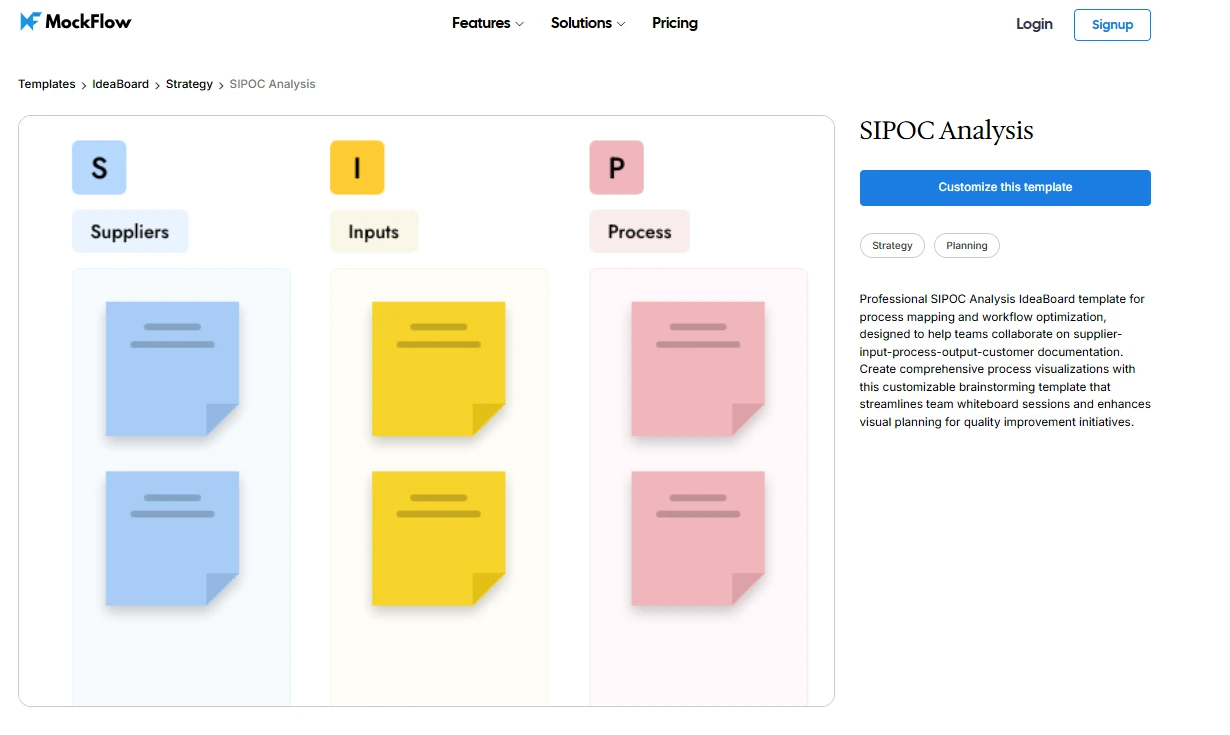
Customize this operations SIPOC analysis template in IdeaBoard
4. Value stream map
A value stream map visualizes the flow of materials, information, and activities involved in delivering a product or service. It helps teams identify inefficiencies, reduce waste, and improve process flow.
Value stream maps highlight:
- Value-added activities: Steps that directly contribute to the final outcome.
- Non-value-added activities: Tasks that consume time or resources without adding value.
- Delays and bottlenecks: Points where work slows down or waits.
- Process waste: Unnecessary steps, movement, or effort that can be reduced.
Commonly used in Lean process improvement, value stream mapping helps teams analyze the current workflow and identify opportunities to create a more efficient process. A 2025 outpatient-clinic case study found a 43.9% reduction in modeled lead time. Redistributed workloads and parallel treatment lanes reduced waiting without affecting value-added care.
Common use cases include:
- Manufacturing production workflows
- Supply chain processes
- Order fulfillment processes
Begin with a high-level current-state view, then start broad and add detail around the delays, rework loops, and bottlenecks that warrant action. Mapping every activity at the same depth can consume time without producing equally useful findings.
5. Workflow diagram
A workflow diagram connects people, systems, tasks, and stages to show how work progresses. It makes sequences, approvals, dependencies, responsibilities, and exceptions easier to follow across operational workflows.
Workflow diagrams are useful when teams need to visualize how work moves across different steps and stakeholders. Common use cases include approval workflows, document review processes, and internal operations.
Common examples include:
- Invoice approval workflow
- Content publishing workflow
- Software deployment workflow
For example, an online course development workflow can show how work moves from course planning and content creation to review, revisions, and publishing. A workflow diagram template helps teams organize these stages visually and understand how different tasks connect throughout the process.
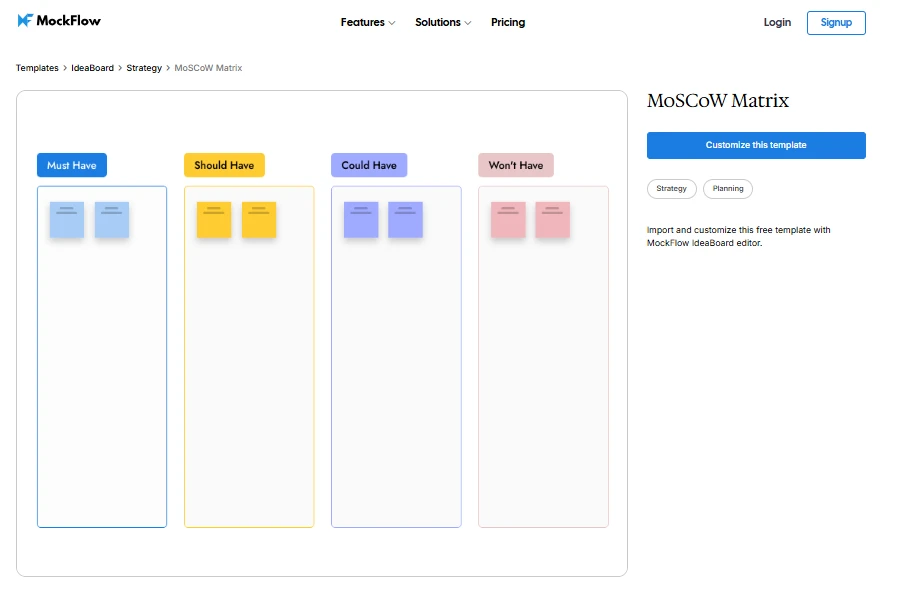
Customize this online course development workflow diagram in IdeaBoard
6. High-level process map
A high-level process map shows the major stages of a workflow without detailing every task, decision, or dependency. It helps teams understand the overall process flow, define scope, and align stakeholders before moving into deeper analysis.
High-level process maps are useful for:
- Executive presentations
- Process scope definition
- Client discussions
Common examples include:
- Customer journey overview
- Product development lifecycle
- Order-to-delivery process
For example, a product development lifecycle map can outline key stages such as idea generation, planning, development, testing, and launch. A product development mind map can help teams organize these stages visually and build a shared understanding of the overall process before creating more detailed workflows.
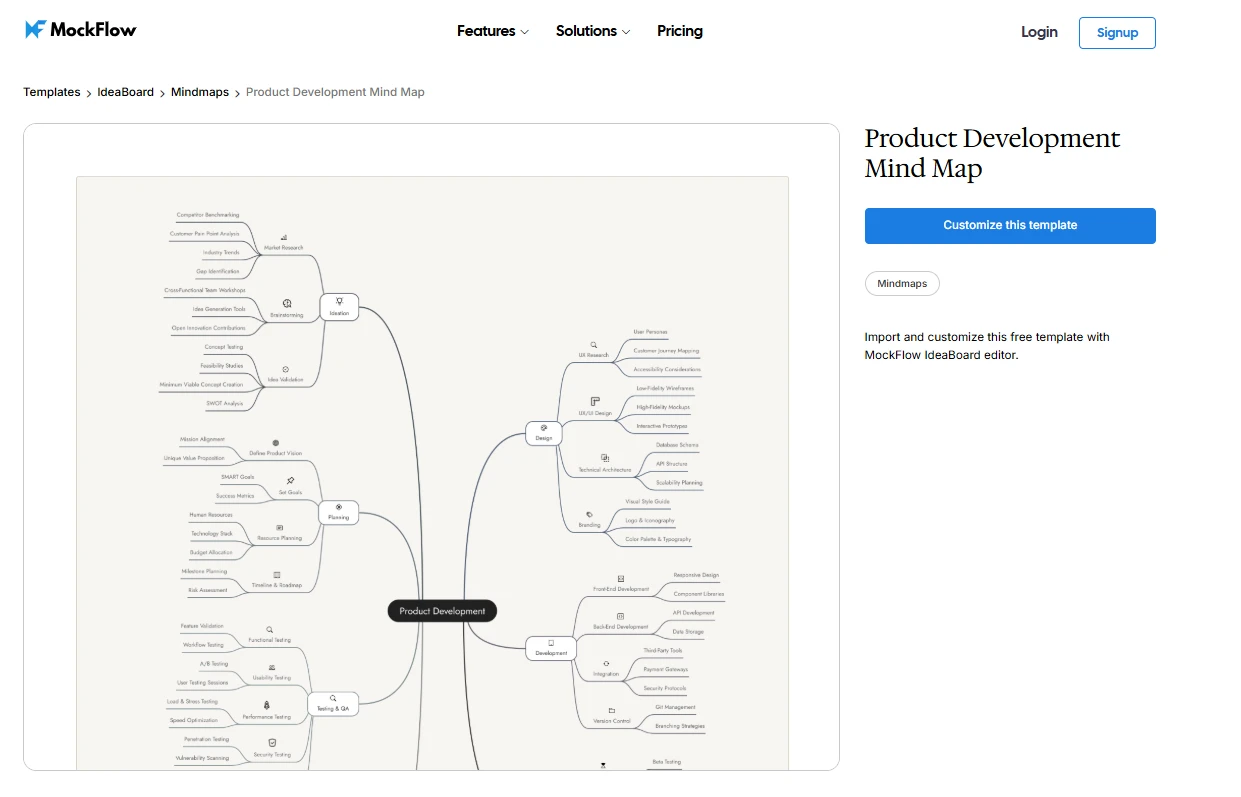
Customize this product development mind map in IdeaBoard
7. Detailed process map
A detailed process map breaks a workflow into smaller tasks, decisions, and dependencies. It provides a deeper view of how a process works by capturing activities, roles, inputs, outputs, and exceptions.
Detailed process maps are useful for:
- Process optimization
- Training documentation
- Complex operational workflows
Common examples include:
- IT support ticket resolution
- Healthcare patient workflows
- Employee onboarding processes
For example, an employee onboarding process map can cover offer acceptance, documentation, system access, orientation, training, and completion. Use our employee onboarding process prompt as a starting structure, then adjust it to fit your roles, policies, and approval requirements.
How to create and use a process map with IdeaBoard
A useful process map must reflect how work moves between people, decisions, and systems. IdeaBoard provides a shared visual workspace for creating the map, checking its accuracy, and refining it as the process changes.
Follow these process mapping steps:
- Define the purpose and boundaries: Identify the problem being examined, where the process begins and ends, who will use the map, and how much detail they require.
- Collect information from process owners: Speak with the people who perform and manage the workflow. Review existing documents, notes, and diagrams to identify actual steps, inputs, outputs, and exceptions. Mida AI can organize this source material into an initial visual board.
- Choose the appropriate map type: Match the structure to the workflow. Use a flowchart for straightforward decisions, a swimlane map for cross-functional responsibilities, or a detailed process map for tasks, dependencies, and exceptions.
- Document the workflow: Arrange activities in sequence and add owners, decision points, inputs, outputs, and handoffs. AI-assisted diagramming can generate an initial structure from a written description, giving the team a draft to correct and expand.
- Validate the map: Ask stakeholders to confirm that the map reflects how the process operates. Correct missing steps, inaccurate responsibilities, unclear handoffs, and undocumented exceptions before approval.
- Export and share the completed process map: Once the workflow is finalized, teams can export the completed board for operational use while keeping the editable version available for future updates. This helps teams use the process documentation in day-to-day operations without losing the flexibility to refine the workflow later.
- Apply and maintain the map: Use the completed map for training, process reviews, improvement planning, and change initiatives. Assign an owner to update it when responsibilities, systems, or requirements change.
A consistent process mapping workflow connects these activities from initial scoping through validation and continued review. This turns the finished map into an operational reference instead of static documentation.
What are the best practices for creating effective process maps?
A good process map makes workflows easier to understand, analyze, and improve. Following the right process mapping practices helps teams create diagrams that remain useful instead of becoming outdated documentation.
- Keep process maps simple and focused: Avoid adding details that do not support the purpose of the map. Focus on the information teams need to understand the workflow, identify issues, or make decisions.
- Map the actual process, not the assumed process: Document how work happens in practice by involving employees who perform the workflow. Their insights help uncover real challenges, exceptions, and steps that may not appear in existing documentation.
- Choose the right level of detail: Match the level of detail to the goal of the process map. High-level maps work well for understanding overall workflows, while detailed maps are better for operational analysis and process improvements.
- Involve stakeholders during mapping: Ask the people who perform, manage, and depend on the process to check its accuracy. Text, voice, and video comments keep their questions and corrections attached to the relevant tasks, decisions, and handoffs.
- Control sensitive process information: Maps may contain internal responsibilities, systems, or operational details. IdeaBoard File Mode supports file-based workflows when an organization needs greater control over where its process documentation is stored.
Using process maps to understand and improve workflows
The process mapping examples in this guide become more valuable when teams adapt them to guide improvements instead of treating them as static workflow documentation. It gives teams a clear reference for evaluating processes, identifying opportunities, and making informed decisions.
With MockFlow IdeaBoard, teams can review workflows visually, refine process steps, and collaborate on improvements as requirements change.
Teams can use completed process maps during training, planning discussions, process reviews, and change initiatives. Once stakeholders approve the workflow, teams can retain the editable version for future revisions and continue improving the process as needs evolve.
Ready to create clearer workflows? Sign up for IdeaBoard and start mapping processes with your team.
FAQs
1. What is process mapping?
Process mapping is the practice of visually documenting how work moves from its starting point to completion. It shows the steps, decisions, responsibilities, inputs, and outputs involved, helping teams understand the workflow and identify where changes may improve performance.
2. What are some examples of process mapping?
Common process mapping examples include employee onboarding and customer support workflows. Sales processes, order fulfillment, and software development workflows are also frequently mapped because they involve defined stages, assigned responsibilities, important handoffs, and measurable outcomes for the business.
3. What are the most common types of process maps?
Flowcharts and workflow diagrams are common choices for sequential processes. Swimlane diagrams clarify responsibility across teams, SIPOC diagrams define process scope, and value stream maps identify waste across the delivery of a product or service.
4. How do we choose the right process map?
Choose a process map based on workflow complexity, the number of stakeholders involved, the required level of detail, and the improvement objective. Use a simpler format for straightforward processes and a structured cross-functional map when ownership or dependencies matter.
5. How do you create a process map?
To create a process map, define its purpose and boundaries, gather information from process owners, arrange the steps in order, add decisions and responsibilities, and select suitable symbols. Review the draft with stakeholders before documenting the approved workflow.
6. What are the top 10 process mapping tools?
The top 10 options are MockFlow IdeaBoard, Lucidchart, Creately, Miro, ClickUp, Canva, Mural, Microsoft Visio, SmartDraw, and Notion. This process mapping software comparison evaluates their capabilities, collaboration options, usability, integrations, and pricing for different business needs.

8 SaaS Website Design Trends to Watch in 2026
Introduction If your SaaS website is due for a refresh, the hardest part is often knowing which design ideas are worth...

How to Give and Receive Design Feedback in Product Design
Design feedback is how teams catch problems before they become expensive mistakes. It's the difference between a design that...
What is a Context Diagram? A Guide with Examples & How to Create One
Introduction Launching a new system or improving an existing one? You’ll want to know exactly how everything fits together,...
