Functional Decomposition Diagram: Step-by-Step Guide & Templates
Introduction
A functional decomposition diagram helps you turn a system’s main purpose into a clear hierarchy of functions and sub-functions.
As you build one, you can decide which capabilities sit under the main function, how each supports it, and how much detail each branch needs. Getting that balance right keeps the diagram useful, it can clarify responsibilities and requirements while staying easy to follow.
In this guide, we’ll explain how the hierarchy works and build one step by step using an e-commerce example. You’ll also see how a functional decomposition template can help you map the structure and refine it with your team.
What is a functional decomposition diagram?
A functional decomposition diagram is a hierarchical view of a system or process that shows how its primary function can be divided into smaller functions and sub-functions. Its top-down structure makes each function’s role and relationship to the overall purpose easier to understand, analyze, and define.
The diagram is made up of four key components:
- Main function: The system’s overall purpose or functionality.
- Sub-functions: Smaller functions that work together to support the main function.
- Hierarchical levels: Layers that arrange functions from broad to specific.
- Connectors: Lines that show parent-child relationships between functions.
The diagram describes what a system does. A flowchart is useful when you need to show the order of activities or decisions.
How does functional decomposition work?
Functional decomposition starts with the system’s primary function. You then break it into major functions and continue dividing those into smaller sub-functions. Each level adds detail while showing how its functions support the level above.
For example, a simple three-level hierarchy might look like this:
- Main function: Support customer service
- Sub-function: Resolve customer requests
- Smaller function: Categorize incoming requests
Continue decomposing until each function is clear enough for the work ahead, such as analyzing the system, defining requirements, or planning implementation. In Harness’s 2025 survey, one in four engineering leaders said more than 70% of requirements lacked clearly defined acceptance criteria. The right stopping point depends on what your team needs to understand or decide.
Related Read: What is a Context Diagram? A Guide with Examples & How to Create One
How to create a functional decomposition diagram
MockFlow is a shared visual workspace for brainstorming, diagramming, wireframing, and planning. For functional decomposition, teams can use the board to map a system’s main function, break it into supporting functions, and refine the hierarchy together. Let’s take a closer look at the process.
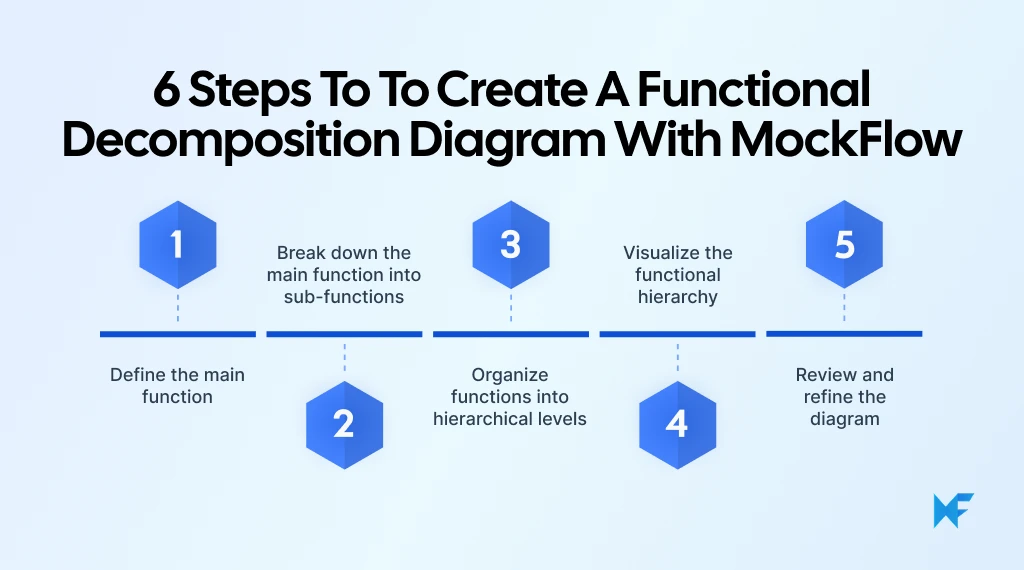
Step 1: Define the main function
Start by stating the system’s purpose in one sentence. If you’re still shaping the idea, you can:
- Use MockFlow’s brainstorming templates to help your team surface possible functions and discuss how they support the system’s purpose.
- Start with a blank canvas and sticky notes to capture, group, and refine ideas before choosing the main function.
Once the purpose is clear, write it as the root function. For an e-commerce platform, that could be Manage e-commerce operations.
Set the scope by deciding which parts of the platform to map and what the diagram should clarify. You can use MockFlow’s functional decomposition diagram template to map the main function and its branches, making it easier to keep the scope clear.
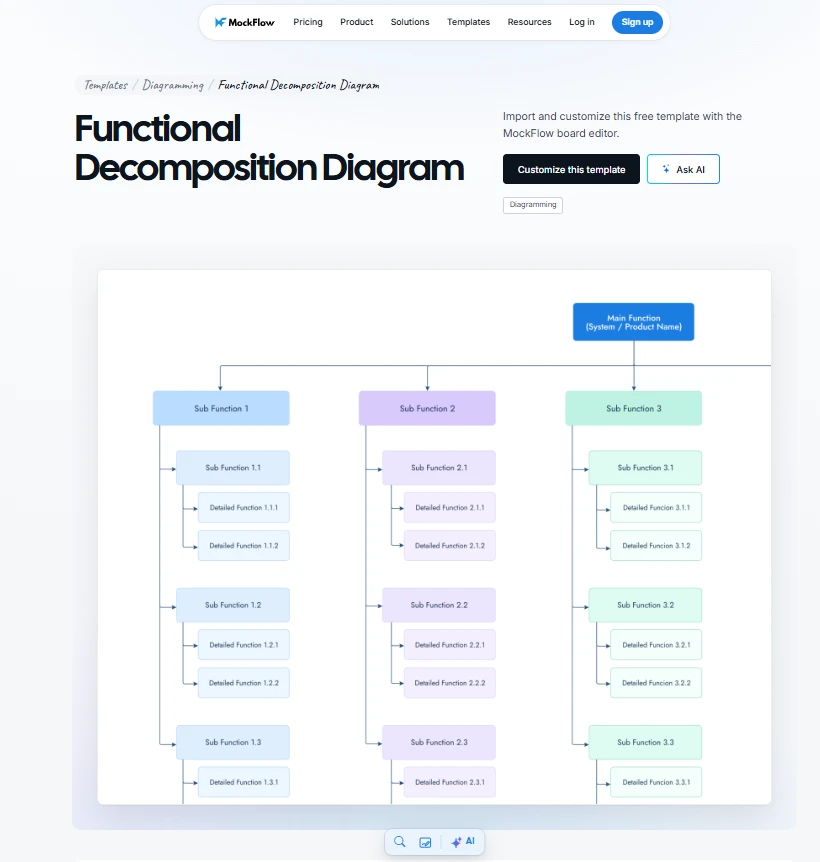
Customize this functional decomposition diagram template
Related Read: 25 Brainstorming Techniques: Methods, Steps, and Use Cases
Step 2: Break down the main function into sub-functions
Identify the capabilities that support the main function. For an e-commerce platform, these could include user management, product catalog, order processing, payment processing, and shipping management. Break each into smaller functions where useful. For example, order processing could include creating an order, checking its status, and handling cancellations.
To keep parent-child relationships clear as you add detail, you can build the hierarchy as a Tree in MockFlow’s SiteMap/Org/Tree frame. Tab adds a child node, Enter adds a sibling, F2 renames a node, and Delete removes one. You can also import an existing hierarchy from a text outline, CSV, or structured file.
Step 3: Organize functions into hierarchical levels
Arrange functions from broad to specific. For an e-commerce platform, the first three levels could look like this:
- Level 0: Manage e-commerce operations
- Level 1: User management, Product catalog, Order processing, Payment processing, Shipping management
- Level 2: Under Order processing: Create order, Track order, Cancel order
Parent-child links show how functions support one another, not when tasks happen. Use functional decomposition to map system capabilities and a WBS to organize project work. MockFlow’s diagramming options cover both, helping you choose a structure that fits your team’s goal.
Keep the hierarchy focused on what the system must do; map those functions to logical components and physical technologies during later design work from function to implementation.
Step 4: Visualize the functional hierarchy
With the functions agreed, arrange the main function above the major capabilities, with supporting sub-functions beneath their parent. Keep labels concise and connectors clear so the relationships are easy to follow.
Mida AI can generate an initial Tree from a prompt or natural-language description. For example, you can use a prompt like this:
“Decompose an e-commerce platform into its major functions: user management, product catalog, order processing, payment processing, and shipping management. Add the relevant sub-functions for each and organize everything into a top-down hierarchy.”
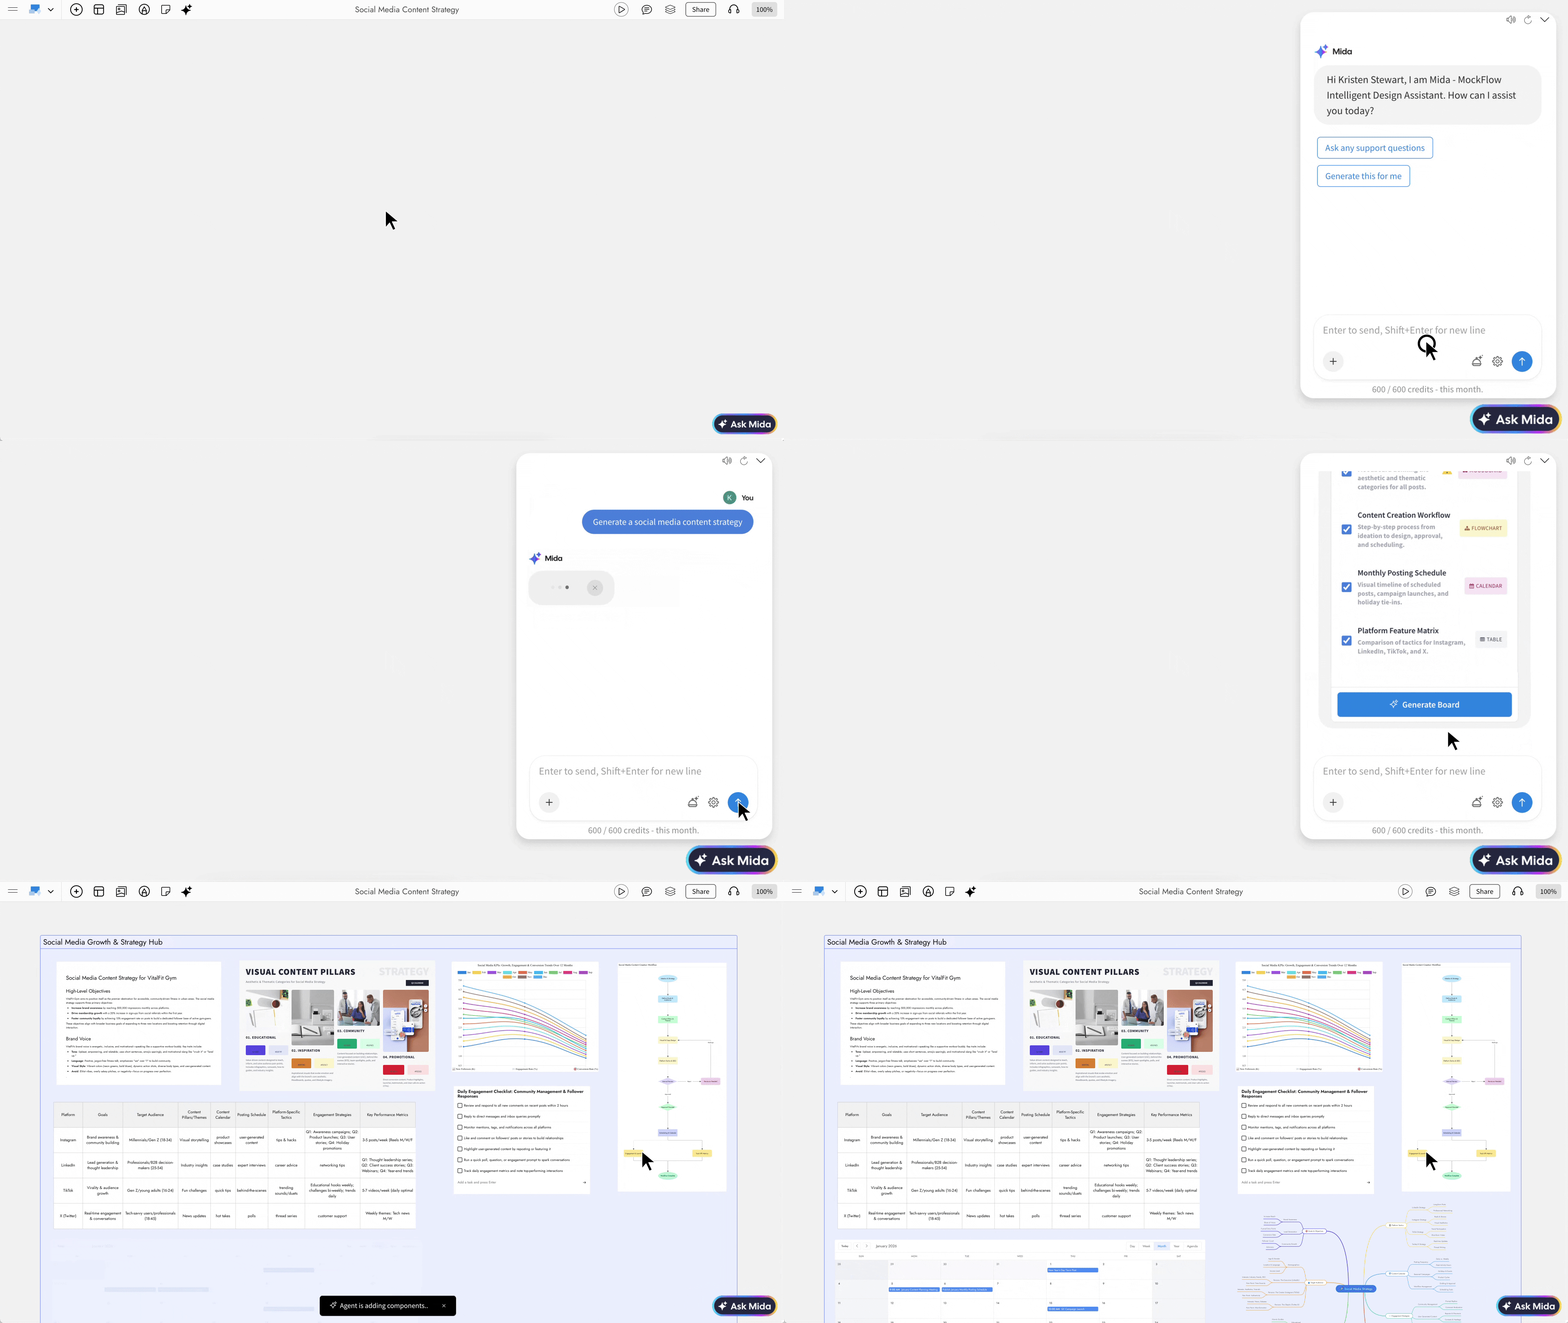
Review the generated hierarchy before using it. Check that each function fits the system, sits under the right parent, and has an appropriate level of detail. You can also build the Tree manually.
If you’re stuck on how to shape the prompt, MockFlow’s AI Prompt Box lets you add guided instructions and a suggested prompt to the shared board, giving your team a consistent starting point.
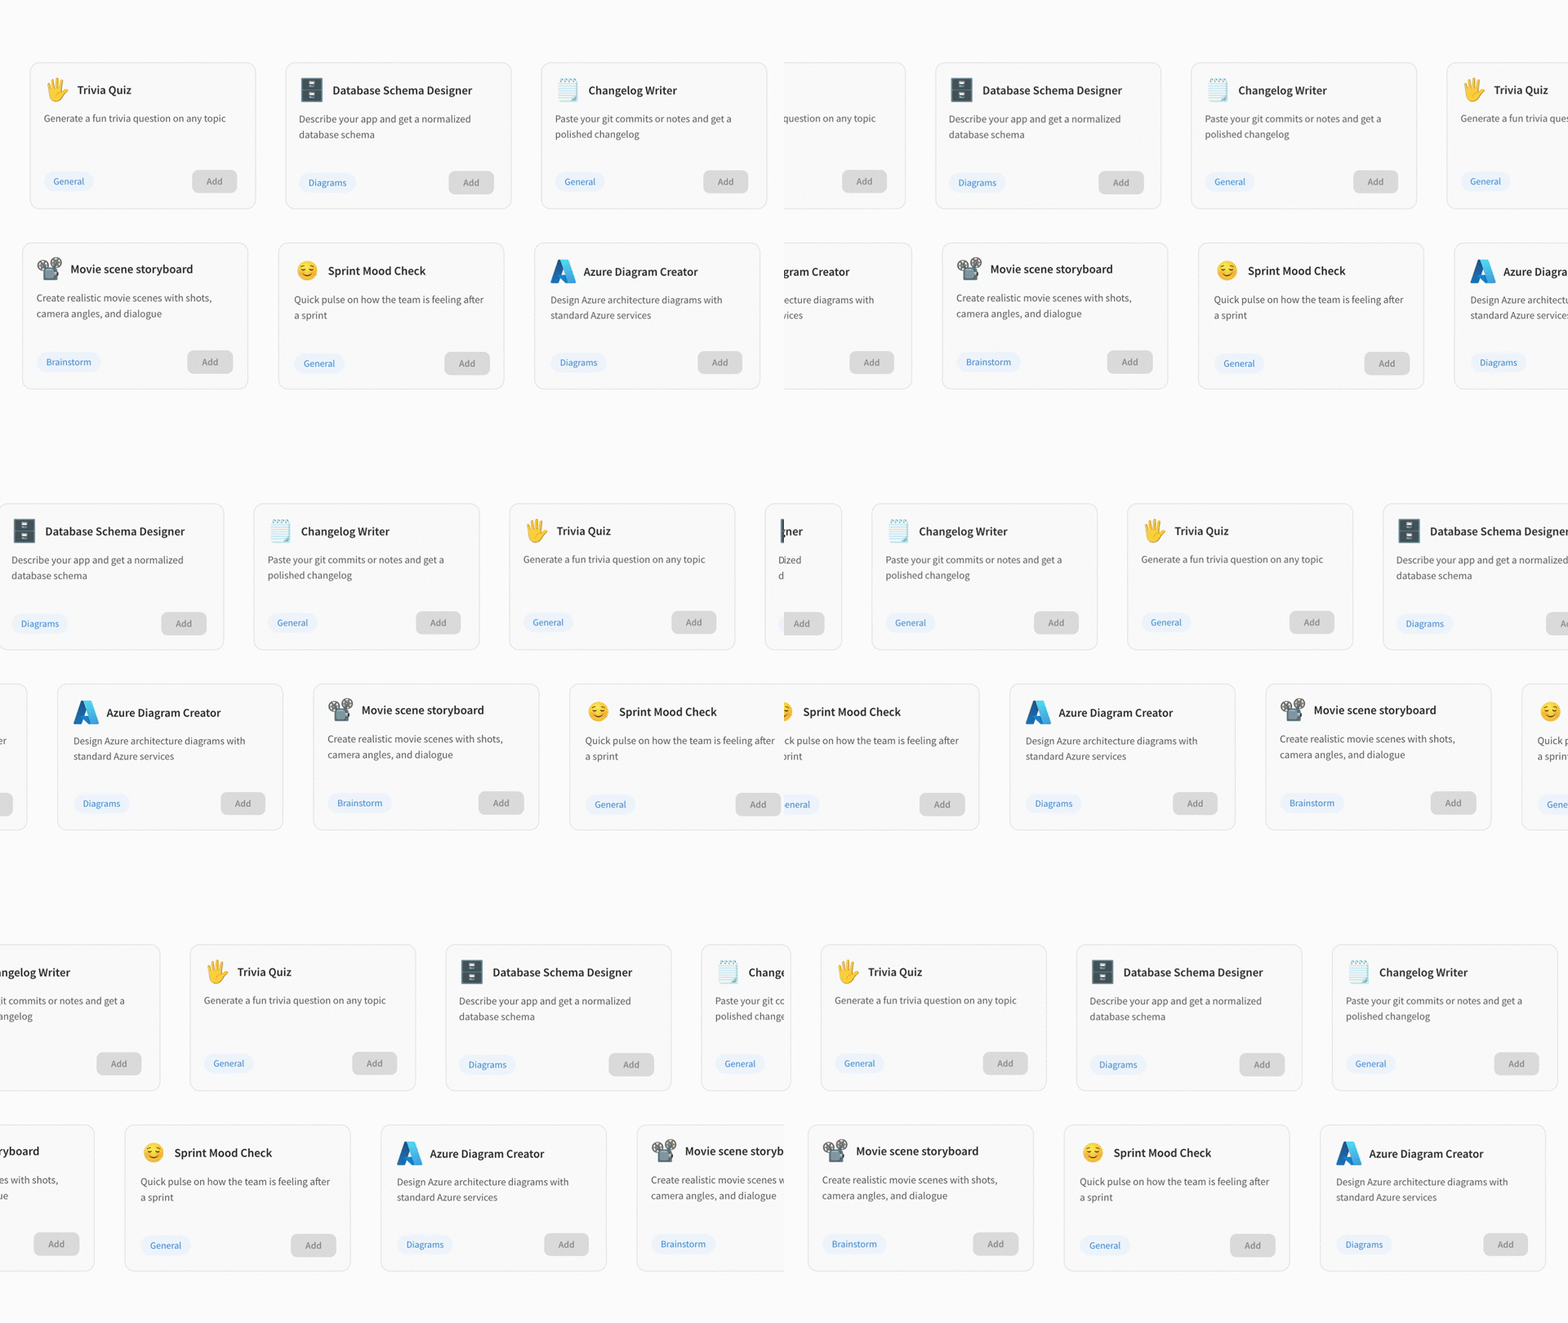
If you need several system visuals together, Mida’s multi-visual board generation makes it simple, describe what you need in plain language, and Mida can organize a prompt, document, or image into a board with multiple components. You can review the proposed components before generating the board.
Step 5: Review and refine the diagram
Review the hierarchy with the people responsible for each function. Check for missing or duplicated functions, confirm each one has the right parent, and make sure the level of detail supports the work ahead. Teammates can refine the shared board together and add voice or video comments to explain questions or suggest changes.
If your team works in Claude, Cursor, or VS Code, you can ask the assistant to create an editable Tree or WBS diagram from a prompt or document on MockFlow. Your team can then review and refine the hierarchy without rebuilding it by hand.
Benefits and applications of functional decomposition diagrams
Functional decomposition makes complex systems easier to understand by breaking them into manageable functions. The hierarchy helps teams clarify requirements, spot gaps or overlap, consider maintainable module boundaries, and discuss system scope using a shared view.
Application | Practical benefit |
Business process analysis | Break a service into functions to see what’s covered, where functions overlap, and what may be missing. |
Software and system design | Group capabilities into potential modules, making boundaries easier to define and changes easier to assess. |
Requirements gathering | Map stakeholder needs to functions to uncover unclear or missing requirements before implementation. |
System maintenance and change planning | Trace a proposed change to the functions it may affect, helping teams identify areas to review. |
Stakeholder alignment | Give business, product, and technical teams a shared view of system scope and responsibilities. |
PMI’s 2025 survey found that 83% of project professionals with high business acumen reported meeting business goals on their projects, compared with 78% of other project professionals. The finding reinforces the value of keeping business goals visible when defining a system’s main function and its supporting branches.
Conclusion
A functional decomposition diagram turns a system’s purpose into a hierarchy of functions and sub-functions, giving teams a clearer view of what the system needs to do.
With MockFlow, you can start from a prompt, a template, or an existing outline, then build and refine the hierarchy on a shared board. The Tree structure keeps parent and child functions connected as the diagram grows. Your team can review the branches together, adjust the level of detail, and keep related system diagrams nearby. Export the finished hierarchy for discussion or documentation.
Ready to simplify your functional decomposition workflow? Start using MockFlow for free and see how it fits your team.
FAQs
1. What is an example of functional decomposition?
An e-commerce system can be decomposed into user management, product catalog, order processing, payment processing, and shipping. Each can be broken down further, for example, order processing may include creating an order, tracking its status, and handling cancellations.
2. How many levels should a functional decomposition diagram have?
There is no fixed number of levels. Many diagrams use at least three: the main function, major functions, and supporting sub-functions. Continue breaking functions down until they are detailed enough for your analysis, requirements, or implementation planning.
3. What is the difference between a functional decomposition diagram and a flowchart?
A functional decomposition diagram organizes a system’s functions into a hierarchy, showing how smaller functions support the main function. A flowchart shows the sequence of activities and decisions. Use the hierarchy to understand scope and the flowchart to trace activity.
4. Which tool can we use to create a functional decomposition diagram?
MockFlow’s Tree type supports parent-child hierarchies, so you can map a system’s main function and its sub-functions. You can also generate a Tree from a prompt, edit its nodes, or import a hierarchy from a CSV or text outline.
5. What are the limitations of functional decomposition diagrams?
Functional decomposition diagrams can become hard to read when a system has many functions or levels. They don’t show task sequence or data movement. Pair the hierarchy with a flowchart or data flow diagram when your analysis needs those views.
6. What is the difference between functional decomposition and a data flow diagram?
A functional decomposition diagram shows how a system’s main function breaks into smaller functions and sub-functions. A data flow diagram shows how data moves between processes, external entities, and data stores. Use them together to understand system capabilities and information movement.

How to Give and Receive Design Feedback in Product Design
Design feedback is how teams catch problems before they become expensive mistakes. It's the difference between a design that...

Wireframe vs Mockup vs Prototype: What’s the Difference?
Wireframes, mockups, and prototypes are three stages of the product design process. Wireframes define layout and structure,...

10 UI/UX Design Trends to Watch For in 2026
Introduction UI/UX design in 2026 is moving in two directions at once. Interfaces are becoming more adaptive, intelligent, and...
