What Is a Data Flow Diagram (DFD)? Symbols, Levels & Examples
Introduction
When information moves between different systems, tracking its path becomes challenging because each process may handle or pass along the data differently. For example, customer details may travel between an application and a payment provider before reaching a delivery system. A change in one process could disrupt the information another process needs.
This is where understanding what is a data flow diagram (DFD) becomes useful. By visually mapping how information passes between systems, a DFD helps you see where data is handled and identify gaps before they affect the system.
This guide explains how DFDs work, what their symbols and levels represent, and how to create one using examples from common software and business systems.
What is a data flow diagram (DFD)?
A data flow diagram (DFD) visually represents how information enters a system, moves between processes, and gets transformed before reaching its destination. It shows how data is exchanged with external entities and stored for later use, helping teams understand the flow of information within a defined system boundary.
For example, in an online ordering system, a DFD traces customer order details through order processing and into the orders database. It also shows how the resulting confirmation reaches the customer, making the exchange of information easier to follow.
This makes data flow diagrams useful for several reasons:
- Improved system visibility: See how information travels between processes and where each data transfer leads.
- Clearer requirements analysis: Identify the information each process needs and the outputs it must produce.
- Easier identification of gaps: Spot missing data paths, unnecessary transfers, or processes with unclear responsibilities.
- Better system documentation: Maintain a visual reference that helps teams understand existing systems and plan changes.
- Improved collaboration: Give technical teams and business stakeholders a common view of how information moves through the system.
- Greater visibility into data handling: Identify where information is stored or shared to support security and risk analysis.
Documentation also plays an important role in how developers understand systems. According to the 2025 Stack Overflow Developer Survey, nearly 68% of respondents used technical documentation to learn coding skills. This highlights the continued importance of clear documentation, which DFDs can complement by visually explaining how information moves through a system.
Data flow diagram vs. flowchart: What's the difference?
A data flow diagram shows how information moves through a system, while a flowchart shows the sequence of activities and decisions. Their arrows also serve different purposes: DFD arrows represent data transfers, while flowchart arrows indicate the order in which actions occur.
Here's how they compare:
Aspect | Data flow diagram (DFD) | Flowchart |
Purpose | Shows how data moves and gets transformed | Shows the sequence of activities |
Main elements | Entities, processes, data stores, and flows | Actions, decisions, start/end points |
Arrows | Represent data transfers | Represent the direction of control flow |
Typical use | Systems analysis and data requirements | Workflow design and process documentation |
Consider the same online ordering system:
- DFD: Shows how customer order details move through processing and into storage.
- Flowchart: Shows the steps involved in placing an order, including what happens when a payment succeeds or fails.
What are the components and symbols of a data flow diagram?
A data flow diagram uses four main components to show how information moves through a system. Each component has a distinct symbol that helps identify where data originates, how it's processed, and where it's stored.
The table below explains the four DFD symbols using an online ordering system as an example.
Component | Common symbol | What it represents | Example |
External entity | ▭ Rectangle | A person, organization, or system outside the system boundary that sends or receives data. Also called a source, sink, or terminator. | A customer submitting order details or a payment provider returning payment status. |
Process | ◯ Circle or ▢ rounded rectangle | An activity that receives and transforms data into an output. Processes use action-oriented labels such as "Validate Order." | A "Validate Order" process converts submitted order details into a validated order. |
Data store | ║ Parallel lines or ⊏ open-ended rectangle | A repository that retains information for later retrieval or modification. It can represent a database, file, or collection of records. | An Orders Database stores confirmed order details for future retrieval. |
Data flow | ⟶ Labeled arrow | The movement of information between components. The arrow indicates direction, and its label identifies the data being transferred. | "Order Details" flows from the customer to the ordering system. |
These symbols describe the movement and handling of information. The arrows represent data transfers rather than procedural decisions or the sequence in which activities occur.
Before connecting components, establish what each arrow should represent. In a DFD, arrows should follow the direction of the information being transferred, not simply point toward the system initiating an action. For example, an API request and its response may require separate arrows because data moves in both directions.
Related Read: 30 Flowchart Symbol Meanings: Shapes & Uses Explained
Yourdon and Coad vs. Gane and Sarson DFD notations
Yourdon and Coad and Gane and Sarson are two commonly used DFD notation styles. Both use the same four components, but their symbols differ slightly, particularly for processes and data stores.
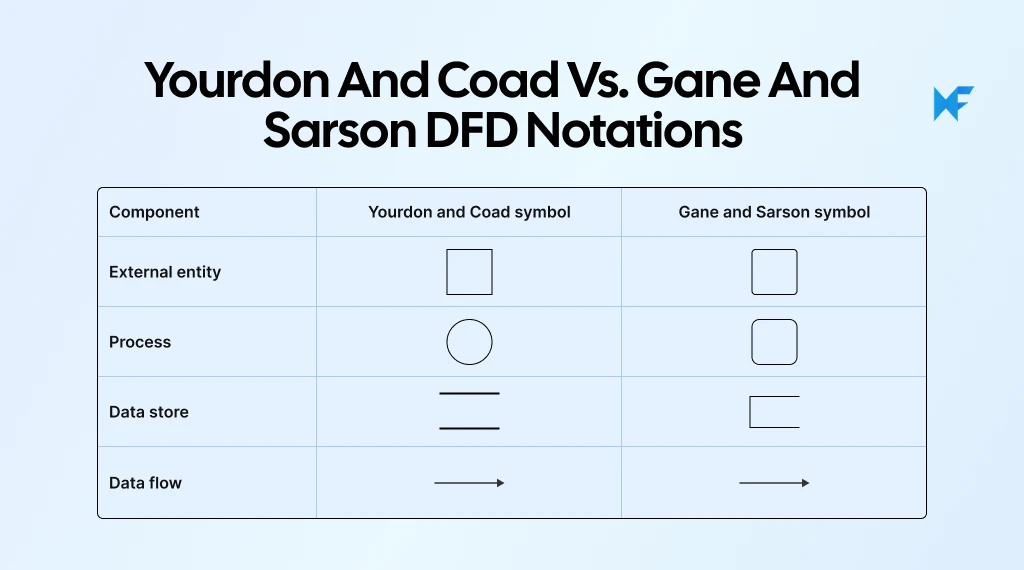
Both styles represent the same information relationships. A few points to keep in mind when choosing a notation:
- Keep the notation consistent: Use the same symbol conventions across your diagrams, especially when creating multiple DFD levels. This helps readers recognize components without having to reinterpret their meaning.
- Prioritize clear labeling: Give processes action-oriented names and label data flows according to the information being transferred. Clear labels make the diagram understandable regardless of which notation you choose.
With MockFlow, you can generate a diagram from a short description using AI, then manually refine the shapes and connections to follow your chosen DFD notation. Keeping the diagram on the same visual canvas as your notes and plans also makes it easier to review data relationships and collaborate on changes.
What are the different levels of data flow diagrams?
Data flow diagrams typically use three levels: Level 0, Level 1, and Level 2. Each level adds more detail to the same system, starting with an overview and gradually breaking down individual processes.
This approach, called decomposition, helps you examine how data moves through smaller functions without overcrowding a single diagram.
1. Level 0 DFD: Context diagram
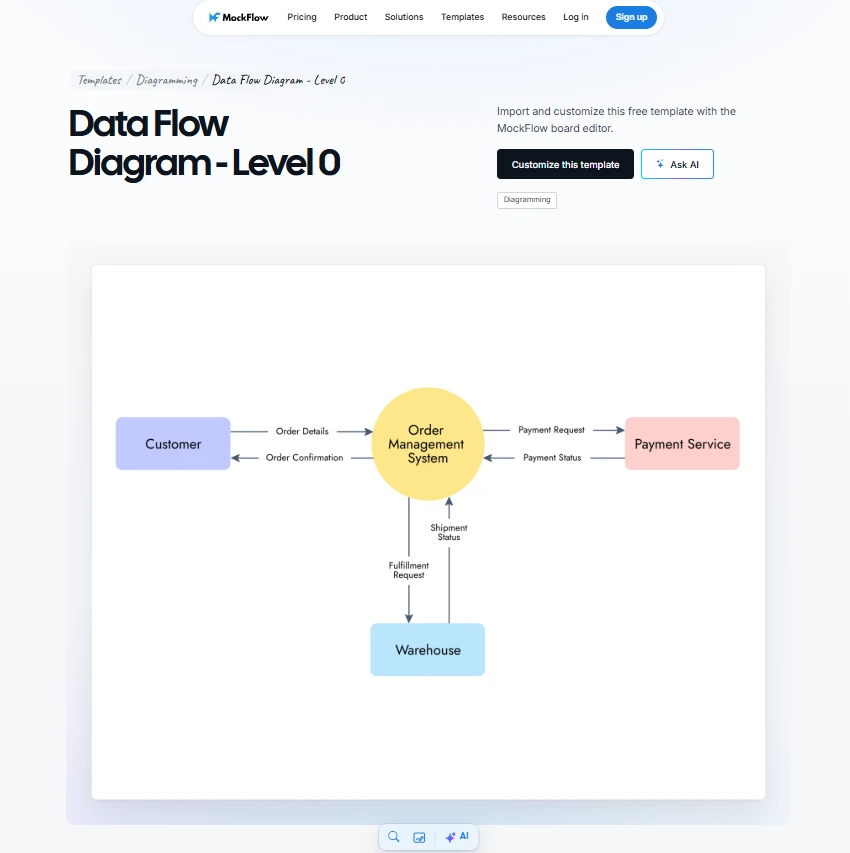
A Level 0 DFD, also called a context diagram, represents the entire system as a single process. It defines the system boundary by showing which external entities exchange information with the system and what data moves between them.
A useful starting point is to list the systems and users involved, along with the information they exchange. Mark any unclear data transfers for stakeholder review before expanding the diagram into detailed processes. This helps establish the system boundary without introducing assumptions into later DFD levels.
For an online ordering system, the context diagram would show:
- Customer: Sends order details to the system and receives an order confirmation.
- Payment provider: Receives payment requests from the system and returns payment status.
You can use MockFlow's Level 0 DFD template to map these external interactions without building the diagram from scratch.
Customize this Level 0 data flow diagram
At this level, internal activities such as order validation and payment processing are left out. Data stores are also omitted because the goal is to establish the system's scope and external data exchanges.
2. Level 1 DFD: Main processes and data stores
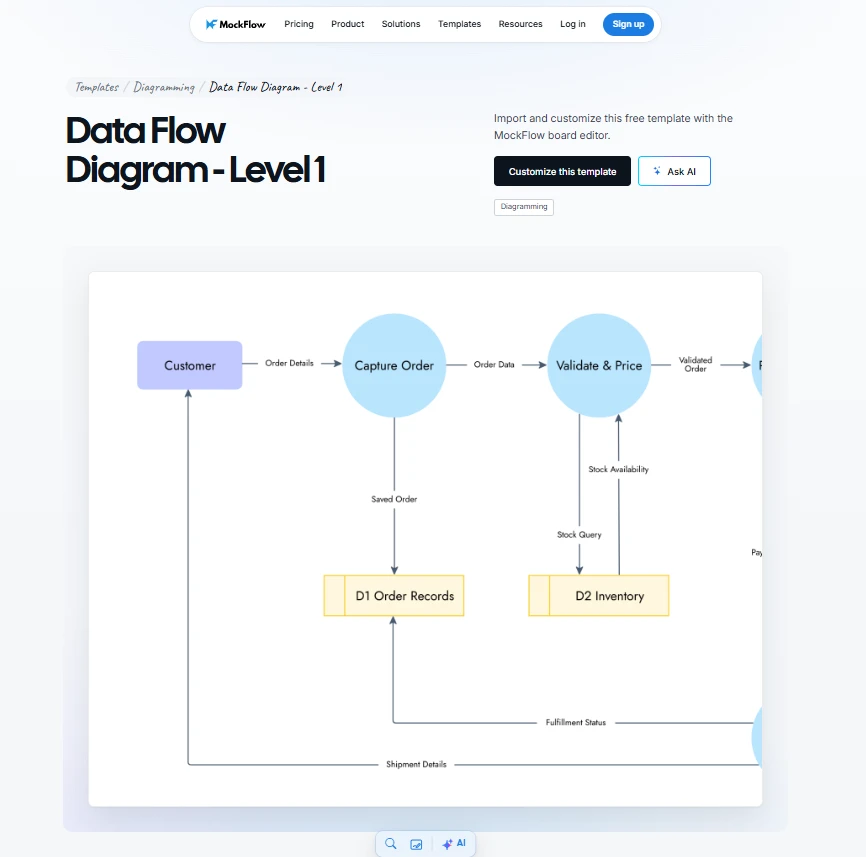
A Level 1 DFD expands the context diagram into the system's main internal processes. Each process receives a number, such as 1.0, 2.0, or 3.0, making it easier to identify how different functions handle information.
For the online ordering system, the main processes could be:
- 1.0 Validate Order: Receives customer order details and produces a validated order.
- 2.0 Process Payment: Uses the validated order to send a payment request to the provider and receive payment status.
- 3.0 Record Order: Stores the confirmed order in the Orders Database and produces an order confirmation for the customer.
A Level 1 DFD also shows the data stores these processes read from or write to, such as customer records and the Orders Database.
MockFlow's Level 1 DFD template saves setup time by giving you a ready-made structure to organize processes and trace data flows.
Customize this Level 1 data flow diagram
3. Level 2 DFD: Detailed subprocesses
A Level 2 DFD breaks down one Level 1 process to show how its internal functions exchange data. This is useful when a process handles several data transformations that need closer examination.
For example, the Level 1 process 2.0 Process Payment can be divided into:
- 2.1 Validate Payment Details: Checks the payment information and produces validated payment data.
- 2.2 Request Authorization: Sends an authorization request to the payment provider and receives the response.
- 2.3 Record Payment Result: Records the transaction result and makes the payment status available for order processing.
To explore payment processing in greater detail, you can use MockFlow's AI data flow diagram generator and map the subprocesses and their data exchanges. This will help you identify missing connections before refining the system design.
Try your first DFD prompt
Subprocess numbers identify their parent process, while deeper levels can be added when more detail is needed. Each level must preserve the inputs and outputs of its parent process, a principle known as DFD balancing.
What are the types of data flow diagrams?
The two main types of data flow diagrams are logical DFDs and physical DFDs. Both represent how information moves through a system, but from different perspectives.
DFD levels determine how much detail a diagram shows, while DFD types distinguish between what a system does with data and how that data movement is technically implemented.
Here's how logical and physical DFDs compare:
Aspect | Logical DFD | Physical DFD |
Definition | Shows what a system does with information and how data is transformed to support business activities. | Shows how data moves through the actual technical components implementing the system. |
Focus | Business processes, data inputs, outputs, and transformations. | How applications and services exchange information and interact with storage systems. |
Components | Business functions and logical data stores. | Application backends, APIs, databases, and other technical components. |
Technical detail | Independent of specific technologies or implementation methods. | Includes implementation-specific details about how information is processed and stored. |
Online ordering example | Shows how customer orders are validated and payments are processed without specifying the technology involved. | Shows how an application backend validates orders, a payment API exchanges authorization data, and an orders database stores confirmed transactions. |
Typical use | Requirements gathering and business analysis to define what the system needs to accomplish. | System design and technical documentation to understand how data exchanges are implemented. |
You can also create cloud architecture diagrams alongside physical DFDs to see which services support each data flow. This makes it easier to understand system dependencies and plan infrastructure changes.
Physical DFDs are particularly useful when examining data exchanges across cloud-based systems. The CNCF's 2025 Annual Cloud Native Survey found that 82% of surveyed container users run Kubernetes in production. This reflects the prevalence of cloud-native infrastructure, where understanding how applications and services exchange data is important for system design.
Data flow diagram examples
Data flow diagrams can help explain information movement across different systems, from online ordering platforms to internal management applications. The following data flow diagram examples show how external entities interact with processes and how information moves between them.
1. Online ordering system
An online ordering system handles customer details and payment information before recording an order and sending confirmation.
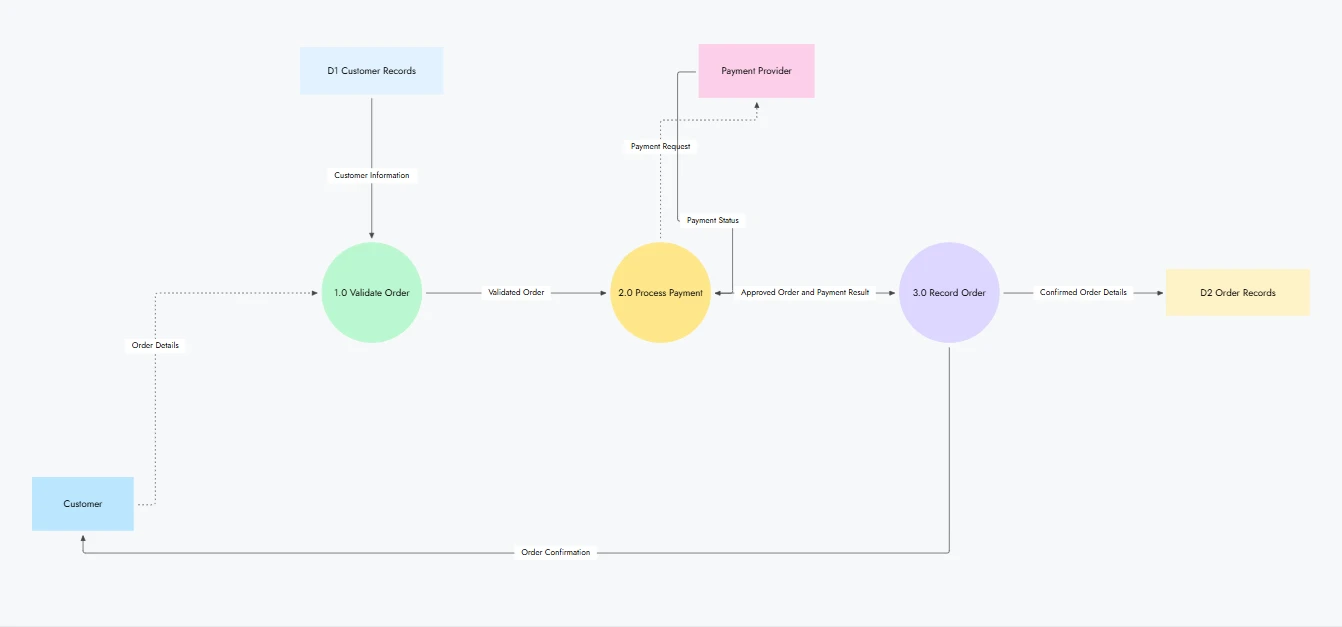
Online ordering system DFD created with MockFlow
A Level 1 DFD shows how information moves through the system:
- External entities: The customer submits order details, while the payment provider receives payment requests and returns transaction status.
- Processes: “Validate Order” checks submitted information, “Process Payment” handles payment authorization, and “Record Order: saves the confirmed transaction.
- Data stores: “Customer Records” holds customer information, while “Order Records" stores completed orders.
- Data flows: “Order Details” moves from the customer into validation. The validated order passes to payment processing, and the payment result determines what information is recorded and sent back as confirmation.
This DFD helps teams trace which information each process needs and where an incomplete or missing data transfer could affect order processing.
2. Library management system
A library management system uses data flow diagrams to show how borrowing information is handled and how book records are updated when members borrow or return items.
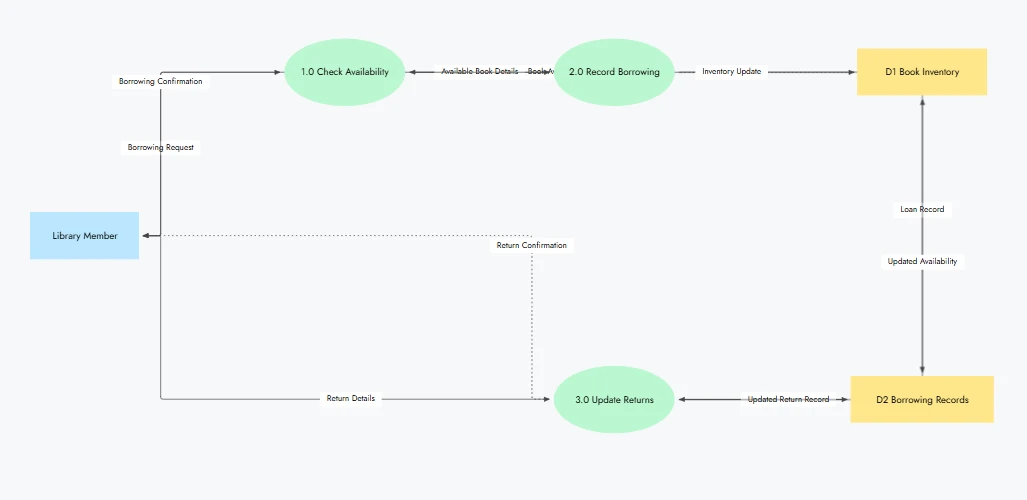
Library management system DFD created with MockFlow
The main components include:
- External entities: "Library Member" submits borrowing or return requests and receives updated transaction details.
- Processes: "Check Availability" retrieves book information, "Record Borrowing" updates loan details, and "Update Returns" records returned books.
- Data stores: "Book Inventory" maintains availability records, while "Borrowing Records" stores active and completed loans.
- Data flows: "Borrowing Request" is received from the "Library Member" and checked against "Book Inventory." The resulting "Loan Record" is saved in "Borrowing Records," while "Inventory Update" updates book availability.
This makes it easier to see how inventory and borrowing records depend on the same information. It also helps identify missing updates that could lead to inaccurate book availability.
3. Customer relationship management (CRM) system
A CRM system handles customer information across different activities. A DFD helps clarify how inquiries become stored records and how those records are accessed or updated by sales teams.
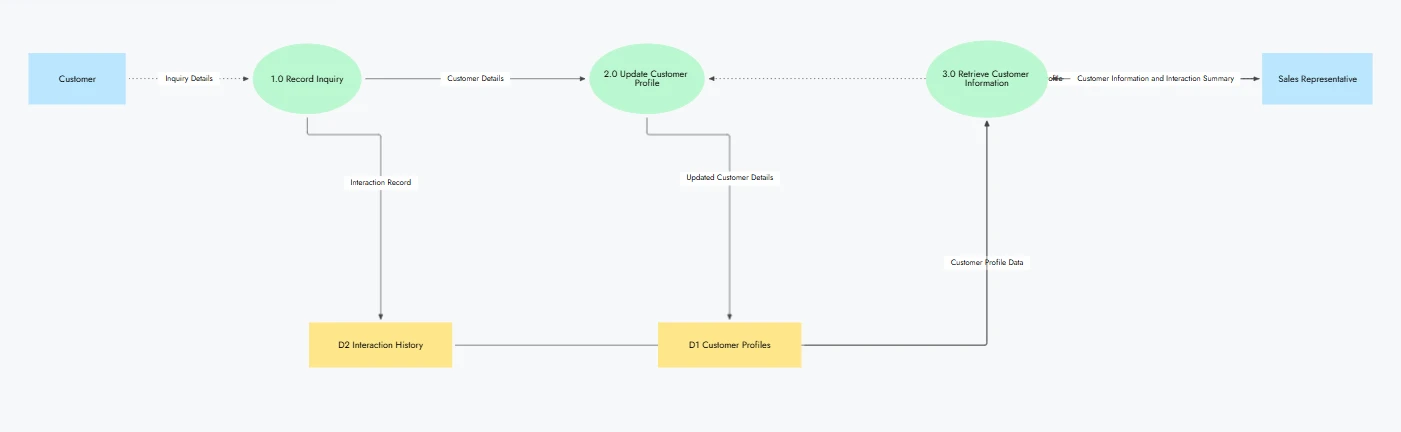
CRM system DFD created with MockFlow
For a CRM system that treats customers and sales representatives as external entities:
- External entities: "Customer" provides inquiries or contact information, while "Sales Representative" requests and updates customer records.
- Processes: "Record Inquiry" captures incoming information, "Update Customer Profile" maintains customer details, and "Retrieve Customer Information" provides requested records.
- Data stores: "Customer Profiles" contains customer details, while "Interaction History" retains previous communications.
- Data flows: "Inquiry Details" enters "Record Inquiry" and is saved as an "Interaction Record" in "Interaction History." "Customer Details" updates "Customer Profiles," which provides "Customer Profile Data" when the "Sales Representative" requests information.
A CRM DFD helps teams understand how customer records support different activities and where missing updates could lead to incomplete information during follow-ups.
These data connections are important to examine, especially when information moves between multiple systems. FormAssembly's 2025 Data Collection Report found that 54% of respondents struggled with data integration and analysis. This highlights why tracing data exchanges can help teams identify where information may become disconnected.
What are the rules for creating a data flow diagram?
A data flow diagram follows specific rules to ensure that every data transfer makes sense and the relationships between components are easy to interpret.
Clear documentation is particularly important when systems involve multiple data exchanges. Postman's 2025 State of the API Report found that 55% of respondents struggled with inconsistent API documentation. This reinforces the value of clear, consistent labels and connections when documenting how information moves through a system.
Following these DFD rules also helps prevent missing connections and inconsistencies as diagrams become more detailed.
Here are six rules to follow when creating a DFD:
- Every process must have an input and output: Each process should receive data and produce a meaningful result. For example, "Validate Order" receives "Order Details" and outputs a "Validated Order." A process without an input or output suggests an incomplete data flow.
- Label every data flow clearly: Use descriptive names that identify the information being transferred. Labels like "Payment Status" or "Order Confirmation" make it easier to understand what moves between components. Avoid vague labels such as "Data" or "Information."
- Tip: When mapping systems that handle sensitive information, identify the data crossing each connection before adding technical details. Label transfers involving personal or payment data and note where encryption or authentication protects those exchanges. This makes it easier to identify data paths that need closer security review.
- Use valid component connections: External entities and data stores must exchange information through a process. For example, a "Customer" cannot send information directly to "Order Records" in a DFD. The information must pass through a process such as "Record Order."
- Maintain consistent naming conventions: Use action-oriented names for processes, such as "Process Payment," and descriptive nouns for data stores, such as "Customer Records." Consistent labels help readers distinguish activities from stored information.
- Keep the focus on data movement: DFDs show how information travels and changes within a system. Avoid adding decision diamonds or loops to represent what happens next. Those details belong in workflow diagrams rather than data flow diagrams.
- Maintain consistency between diagram levels: Check that no data flows are added or lost when expanding a process into smaller subprocesses. This maintains DFD balancing and prevents discrepancies between the parent and detailed diagrams.
When reviewing your DFD, you can correct and edit shapes, connectors, and labels with MockFlow as you check each data flow against these rules. Your team can review the same diagram and resolve inconsistencies before they carry over into system documentation.
How MockFlow helps you create data flow diagrams
MockFlow brings AI-powered diagramming together with wireframing and collaborative whiteboarding in one visual workspace. Its dedicated data flow diagram generator creates editable DFDs, while IdeaBoard lets teams brainstorm system requirements and keep related designs together as the project develops.
Here's how MockFlow supports the process from exploring a system to documenting its data flows.
- Explore and organize your system information: Choose an approach based on how much information you already have.
- Blank canvas: Use sticky notes and connectors to explore data sources and identify relationships before diagramming.
- AI Toolbox: Generate visual brainstorming structures to explore how different processes connect.
- Think with Mida AI: Turn a technical specification or whiteboard sketch into an editable visual board, saving time organizing existing information.
- Brainstorming templates: Structure requirements discussions around a shared visual layout so the team can capture important data dependencies.
- Generate your DFD with AI: Describe your information system in plain language to generate a diagram with labeled data flows. You can also:
- Use the prompt library: Adapt existing prompts to your system instead of writing detailed instructions from scratch.
- Connect through MCP: Create diagrams through compatible AI assistants such as Claude or ChatGPT and bring the results into MockFlow for review.
- Refine the diagram for your audience: Edit process names and correct data connections without redrawing the entire DFD. Choose a professional style for documentation, a sketchy style for requirements discussions, or a 3D isometric style for architecture presentations.
- Explore the system in greater detail: Keep Level 0, Level 1, and Level 2 diagrams together on the infinite canvas to check data relationships across levels. For physical DFDs, add cloud architecture visuals using AWS, Azure, or Google Cloud shapes to understand the infrastructure supporting data exchanges.
- Review and share with your team: Collaborate on the same board in real time or collect audio and video comments for asynchronous review. Once the data flows are verified, export the diagram for documentation.
With MockFlow, your DFD can remain part of the same workspace as the wireframes and planning discussions it supports. This helps teams carry their understanding of data relationships into system design, with fewer handoffs and less context lost between tools.
Conclusion
A data flow diagram helps you understand how information moves through a system and where it gets processed or stored. With the right components and DFD levels, you can build logical or physical views that support clearer system analysis and documentation.
Start with a simple diagram and expand it as you uncover more about your system. With MockFlow, you can generate DFDs using AI and refine them on a shared visual canvas. Your team can review data relationships together and keep diagrams alongside related wireframes as the project develops.
This gives you a clearer path from understanding your system to planning improvements, without juggling disconnected tools.
Ready to simplify your diagramming workflow? Start using MockFlow for free to explore how it fits your team.
FAQs
1. What is a data flow diagram in software engineering?
In software engineering, a data flow diagram helps developers understand how information moves and gets transformed within an application. It's used during requirements analysis to identify data dependencies and during system design to clarify how software components exchange information. DFDs also provide a useful reference for documenting interactions between internal processes and external systems.
2. What is the difference between a DFD and an ER diagram?
A DFD shows how information moves through a system and gets processed, while an entity relationship (ER) diagram shows how data is structured and related within a database.
For example, an online ordering DFD traces how order details are processed, whereas an ER diagram shows the relationships between customer records and orders in the database.
3. What is a data dictionary in a DFD?
A data dictionary is a structured reference that defines the meaning and format of information represented in a DFD. It provides details that diagram symbols alone cannot communicate.
For example, a data flow labeled "Customer Details" might include fields such as Customer ID and Email Address. The dictionary documents these fields so teams interpret the information consistently.
4. Can a data flow diagram show real-time data movement?
Yes, a DFD can represent how information moves through a real-time system, such as payment processing or live inventory updates. However, it remains a static representation of data paths. It shows where information is expected to travel, rather than monitoring actual transactions or displaying live system activity as it happens.
5. What are the limitations of data flow diagrams?
Data flow diagrams don't show when activities execute or how detailed decision logic works. They also cannot represent complete procedural sequences.
Complex systems may require multiple DFD levels to explain their information exchanges clearly. Teams often use complementary diagrams, such as flowcharts for workflow behavior or architecture diagrams for technical infrastructure, to provide additional context.
6. When should a data flow diagram be updated?
Update a DFD whenever system changes affect how information is received or processed. New features, data migrations, system redesigns, or changes to third-party integrations may introduce different data paths. Regular reviews help keep system documentation accurate. For systems with multiple integrations, maintaining a structured record of data connections can simplify diagram updates.
Functional Decomposition Diagram: Step-by-Step Guide & Templates
Introduction A functional decomposition diagram helps you turn a system’s main purpose into a clear hierarchy of functions and...

Collaboration Skills: How to Improve Team Performance and ROI
Introduction Smart teams fail more often than we admit. Deadlines slip when communication breaks down, projects stall when...

Team Planning Process Guide: Steps & Best Practices in 2026
Team planning often starts when the team already feels the pressure. A new quarter is approaching. A major project is about to...
