Org Chart App for Microsoft Teams: Complete 7-Step Setup Guide
Keeping reporting relationships clear is difficult when teams rely on outdated slides, spreadsheets, or separate org chart software. Even a small change can leave employees checking multiple files to understand who reports to whom.
An org chart app for Microsoft Teams solves this by bringing organizational planning into the workspace your team already uses. You can create a new chart, move an existing structure into Teams, plan a reorganization, and clarify formal or dotted-line relationships together.
Microsoft’s built-in views show directory-based reporting data. Visual apps support editing and collaboration, while data-connected tools synchronize employee records.
This guide shows you how to choose, add, create, review, and maintain the right Teams org chart.
How Can You Add an Org Chart App to Microsoft Teams?
You can add an org chart app through the Microsoft Teams Apps directory, then place it in the workspace where people will use it. Depending on the application and our organization’s policies, that may be a channel, meeting, chat, or personal workspace.
Before we walk through the setup, this short video shows how MockFlow IdeaBoard works inside Microsoft Teams, including how teams can open a shared visual workspace in channels and meetings.
The general setup process is:
- Open Apps in Microsoft Teams.
- Search for the org chart application.
- Open its details page.
- Review its features, permissions, pricing, and account requirements.
- Select Add.
- Select Request when administrator approval is required.
- Sign in to the application when prompted.
- Add it to the relevant channel, meeting, chat, or personal workspace.
- Configure viewing and editing access.
Note: Microsoft Teams may show a different installation interface based on the Teams version, app policies, user permissions, and subscription requirements. Team owners can also restrict who adds apps, while some applications require IT approval because they request additional permissions.
What Should You Check Before Choosing an Org Chart App?
An application appearing in Microsoft Teams does not necessarily mean it supports the type of organizational work you need. You should first decide whether you want to view an existing hierarchy, create a visual chart, plan a future structure, maintain an employee directory, or collaborate on a reorganization.
SharePoint users recommend defining the use case before investing in a new application. They suggest starting with native Microsoft 365 features and considering a custom or third-party tool only when teams need richer directory capabilities. Their recommendations focus on the features employees would actually use, the implementation effort, and who would maintain the solution over time.
Before you choose an app, evaluate five areas:
- Teams integration: Can you pin the app to a channel, open it in meetings, use a personal workspace, and edit together? IdeaBoard supports these working contexts and can remain available as a persistent channel tab.
- Data source: Will your team build manually, generate with AI, import data, or connect to Entra ID, SharePoint, or an HR system? Visual chart creation and automatic employee-data synchronization are separate capabilities.
- Administration: Who can install, view, edit, and own the chart? You should also check guest access and what employee information the app can read.
- Licensing: Does every viewer need a license? Are AI generation, Teams access, export, and backups included?
- Maintenance: Can you import an existing chart, export it later, separate current and proposed structures, and assign responsibility for updates?
Questions to answer before installing:
- Are you creating a visual chart or an employee directory?
- Must employee changes update automatically?
- Who needs editing access?
- Will viewers require paid licenses?
- Does the app work inside Teams?
- Can you export the chart later?
Which Features Matter Most in an Org Chart App?
The most valuable features are the ones that match how you plan to create, review, and maintain the chart. Here are some important features to look for in an org chart app:
- Microsoft Teams access: The chart should open where employees already work. Look for an app that can run inside channels, meetings, and personal workspaces. A persistent channel tab is especially useful when teams need to revisit the same chart after a planning session.
- AI-assisted editing: AI can speed up the first draft, but the result must remain editable. A useful AI organization chart generator should let us rename roles, add or remove positions, rearrange reporting lines, and adjust the layout.
- Employee-data connections: Organizations that need automatic updates should verify support for Microsoft Entra ID, SharePoint, Excel, CSV files, HR platforms, or employee databases. Visual chart creation and directory synchronization are separate capabilities.
- Collaborative review: Real-time editing helps stakeholders validate departments and reporting lines together. Text, voice, and video comments can also keep feedback beside the relevant role.
- Governance and maintenance: Check viewing permissions, editing controls, export options, ownership rules, and version history. These features help us separate current, proposed, and archived organizational structures.
How to Create an Org Chart in Microsoft Teams With IdeaBoard
To create an org chart in Microsoft Teams with IdeaBoard, add the app to Teams, choose where the board will live, and build the hierarchy with AI or manually. Your team can then edit roles, departments, reporting lines, colors, and layout before reviewing the chart with stakeholders.
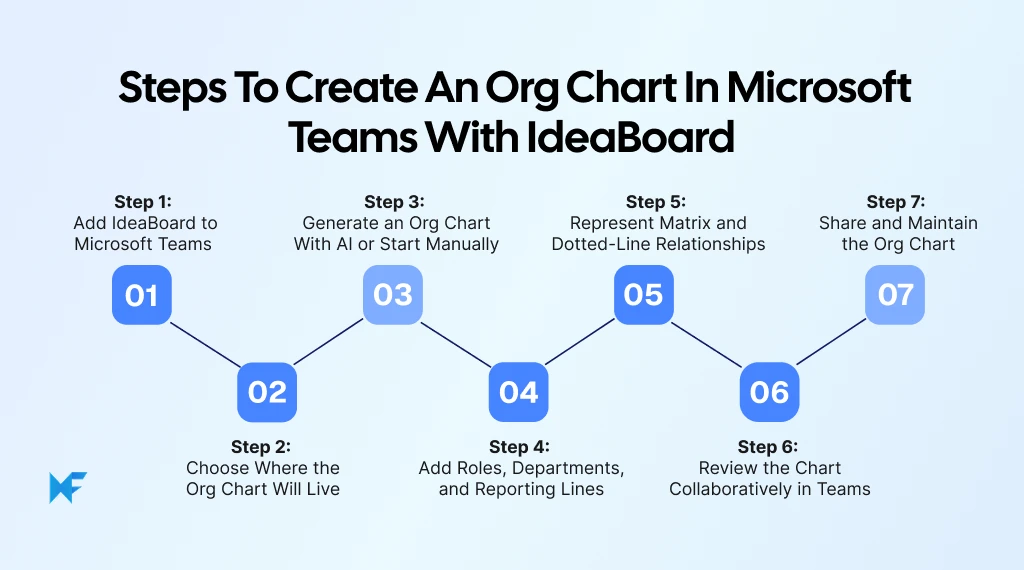
Step 1: Add IdeaBoard to Microsoft Teams
Open Microsoft Teams and select Apps. Search for MockFlow IdeaBoard, open the app details, and select Add. Choose Request if administrator approval is required, then sign in to MockFlow when prompted.
Where the interface allows, pin the app for easier access. Team owners or Microsoft 365 administrators may restrict who can install apps or add tabs.
Step 2: Choose Where the Org Chart Will Live
Choose the workspace based on how the chart will be used:
- A channel tab works well for a company, department, school, or campus chart that people need to revisit.
- A Teams meeting is better for restructuring workshops, leadership reviews, and live reporting-line validation.
- A personal workspace gives us room to prepare a draft or test an AI prompt before sharing it.
The IdeaBoard workspace inside Microsoft Teams supports visual work across these contexts.
Use a descriptive board name, such as “University Leadership Org Chart” or “Proposed Operations Structure”. Add a status label such as “Current,” “Draft,” or “Under review,” along with a visible Last reviewed date.
Step 3: Generate an Org Chart With AI or Start Manually
For a faster first draft, use the organizational chart AI prompt. Describe the top-level role, departments, direct reports, and any secondary relationships. Review every position before publishing because AI-generated structures should be treated as editable starting points.
For example:
- Create an organizational chart for a university.
- Place the President at the top.
- Add the Provost, Vice President of Administration, Chief Financial Officer, and Vice President of Student Affairs below the President.
- Add deans below the Provost and department chairs below each dean.
- Group the roles by academic and administrative departments.
You can then rename roles, add or remove positions, move departments, and correct reporting lines.
For manual creation, open a blank canvas or choose from IdeaBoard’s template library. Add the senior role first, place direct reports below it, and build each level gradually. Keep spacing and styling consistent as the chart expands.
Step 4: Add Roles, Departments, and Reporting Lines
Each role card should contain only the information people need to understand the structure. This may include the employee or role name, title, department, location, manager, and employment status.
Use a consistent visual system:
- Larger cards for senior leadership.
- One color per department.
- Solid connectors for formal reporting lines.
- A dashed border for vacant positions.
- A Proposed or Interim label where relevant.
For instance, a school district chart might place the Superintendent at the top, followed by Academic Services, Operations, Finance, Human Resources, and Technology. Principals can then sit beneath the appropriate administrative leader.
Avoid adding private contact details, compensation information, or performance data to a broadly shared chart.
Step 5: Represent Matrix and Dotted-Line Relationships
Many organizations have functional relationships that do not fit a single vertical hierarchy. Use solid connectors for direct managers and dotted connectors for secondary or functional managers.
Add a short legend so viewers can interpret the chart quickly:
- Solid line: Direct manager.
- Dotted line: Functional manager.
- Dashed box: Vacant position.
- Tinted box: Proposed role.
- Background area: Department or project group.
For example, a university communications manager may report to the Director of Communications while supporting a faculty dean through a dotted line.
If connectors become difficult to follow, create separate department or project views. Bain found that only 22% of employees undergoing an organizational redesign received sufficient training, coaching, or tools to succeed in the new operating model. A dotted line alone cannot provide that clarity, so specify who assigns work, approves decisions, and evaluates performance by adding labels.
Step 6: Review the Chart Collaboratively in Teams
Open the chart during a Teams meeting and ask department leaders to validate their areas. Correct outdated roles, discuss unclear reporting lines, and place comments beside issues that still need confirmation.
A practical review should confirm that:
- Every role has the correct manager.
- Department names and titles are current.
- Formal and functional relationships look different.
- Vacant and proposed roles are labeled.
- Sensitive information has been removed.
- The chart is readable at a normal zoom level.
Real-time collaboration allows the group to make corrections together. For later review, comments can stay attached to the relevant role or department instead of being lost in a separate chat thread.
Step 7: Share and Maintain the Org Chart
Once the chart is approved, pin it to the relevant Teams channel and limit editing access to responsible owners. Assign an administrator, display the “Last reviewed” date, and share or export the board based on stakeholder needs.
Mercer found that 98% of executives expect organizational design changes within 2 years. An org chart can therefore become outdated quickly, so review it after major staffing or structural changes, separate proposed versions, and archive older charts.
A simple ownership model works well:
- IT manages installation and access
- HR verifies employee information
- Department leaders validate their areas
- A named chart owner handles scheduled updates
Benefits of Using IdeaBoard for Org Charts in Microsoft Teams
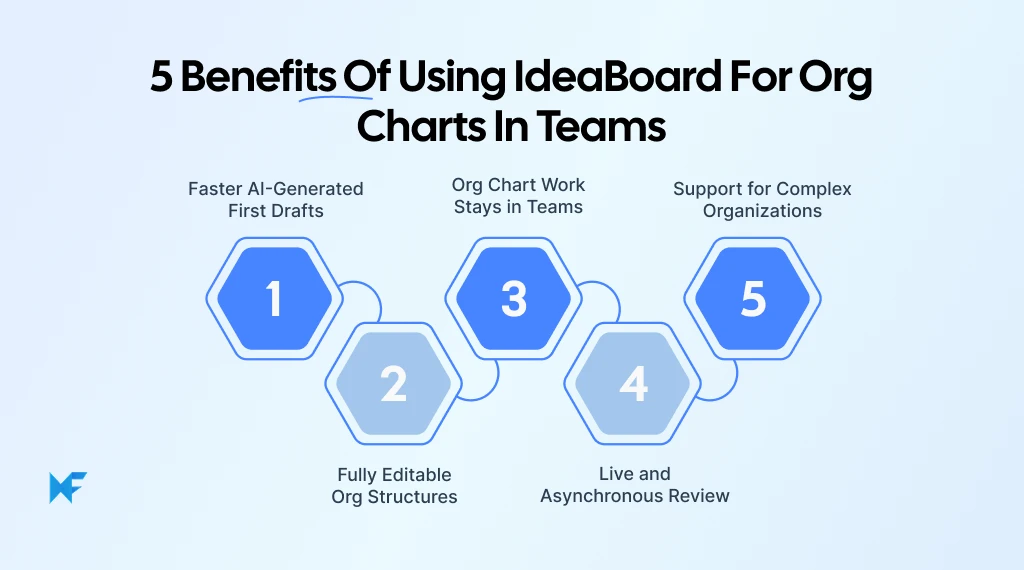
IdeaBoard helps move org chart creation from a separate diagramming task into a collaborative Microsoft Teams workflow. You can generate a first draft with AI, edit the hierarchy visually, review it with stakeholders, and keep the board available for future planning. Here are few more plus points you get with IdeaBoard:
- Faster first drafts: The AI features in MockFlow can turn a written description into a structured starting point. You can test alternative hierarchies by changing the prompt, then verify every role before publishing.
- Editable structures: Roles, departments, reporting lines, colors, and layouts can be changed after generation. This makes it easier to maintain current-state charts and explore proposed structures without rebuilding the canvas.
- Work stays inside Teams: Draft in a personal workspace, review the chart during a meeting, or keep it pinned to a channel. The same board remains available after the discussion ends.
- Live and asynchronous review: Stakeholders can edit together or leave feedback beside the relevant role. This reduces duplicate files and keeps unresolved questions in context.
- Support for complex organizations: Multi-level hierarchies, project teams, governance structures, and matrix relationships can be represented in separate views when needed.
Teams can review IdeaBoard pricing and plan options before rollout or create a MockFlow account to begin building.
Start Building Your Teams Org Chart with IdeaBoard
An org chart is most useful when people can understand it quickly, question it, and keep it current. That is where IdeaBoard fits well inside Microsoft Teams.
Instead of starting with a blank canvas, you can describe the structure to Mida, its built-in AI agent, and use the generated chart as a first draft. From there, the team can refine reporting lines, clarify departments, and shape the layout together in the same workspace where the discussion is already happening.
The result is more than a finished diagram. It becomes a shared visual reference that can support onboarding, planning, and future organizational changes.
When you are ready to try it, create a free IdeaBoard account, open a board in Teams, and see how Mida turns a simple description of your organization into a chart your team can build on.
FAQs
1. Does Microsoft Teams have a built-in org chart?
Yes. The Microsoft Teams Organization tab can show who a person reports to and who reports to them when the feature is available and enabled. Microsoft Org Explorer provides a broader view of managers, roles, titles, and peers. These tools display directory relationships, while a visual org chart app supports custom design, restructuring, and collaborative planning.
2. How do you add an org chart app to Microsoft Teams?
Open Apps, search for the application, and review its details and permissions. Select Add, or choose Request when approval is required. After signing in, place the app in a channel, meeting, chat, or personal workspace. Microsoft Teams administrators and team owners may restrict who can install applications or add tabs.
3. Can IdeaBoard generate an org chart with AI?
Yes. You can describe the hierarchy, departments, roles, and reporting relationships in a prompt to generate an organizational chart. The result remains editable, so you can rename positions, add or remove roles, reorganize departments, correct reporting lines, and change the visual layout. Every generated chart should still be reviewed before it becomes an official organizational reference.
4. Can you show dotted-line reporting relationships?
Yes. Use solid connectors for formal managers and dotted connectors for functional, secondary, or matrix relationships. Add a legend so viewers understand what each connector means. When several lines cross or overlap, create separate department or project views. These visual relationships do not alter the formal reporting information stored in Microsoft 365.
5. Can multiple people edit an org chart in Teams?
Yes. Multiple stakeholders can work together on a shared IdeaBoard canvas, including during a Microsoft Teams meeting. Teams can correct roles and reporting lines in real time, then leave text, voice, or video comments for questions that need later review. This keeps feedback beside the relevant part of the chart and reduces competing file versions.

How to Make a Storyboard? A Step-by-Step Guide for 2026
TL;DR A storyboard is a visual plan that breaks a story, video, animation, scene, or user journey into ordered frames. To...
Miro vs Visio: Side-by-Side Comparison of Features, Reviews & Pricing
Introduction Every team has its own rhythm when it comes to visual collaboration. Some think best when ideas spread loosely...

Asana Whiteboard: How to Add Visual Planning to Asana
Ever had a project that looked clear in Asana, but still felt hard to talk through as a team? That usually happens when the...
