
What Is the Arrow Diagramming Method and How Does It Work?
Project work becomes much easier to understand when we can clearly see how tasks connect with each other. Instead of looking at activities in isolation, we can map them in a way that shows sequence, dependencies, and flow from start to finish.
The arrow diagramming method helps us do exactly that. It provides a visual structure for organizing project activities and understanding how each step leads to the next, making planning and scheduling more transparent.
In this guide, we will explore how arrow diagramming works, its key components, and the difference between Activity-on-Arrow and Activity-on-Node formats. We will also go through a simple example and show how to create the diagram in MockFlow IdeaBoard.
What is the arrow diagramming method?
The arrow diagramming method is a project scheduling technique that represents activities, events, and dependencies in a network diagram. In the Activity-on-Arrow format, arrows show project activities and nodes mark where those activities begin or end, helping us understand task sequence and identify the critical path.
It is also known as Activity-on-Arrow, an AOA diagram, an arrow network diagram, or an activity arrow diagram.
Unlike a calendar-based schedule, it focuses on project logic. It helps us see:
- Which activity must happen first
- Which tasks depend on earlier work
- Which activities can run in parallel
- Which path determines the overall project duration
Arrow diagramming is often used with the Critical Path Method and PERT. The diagram shows how the project is structured, while CPM helps us calculate the longest dependent sequence of activities.
What are the components of an arrow diagram?
An arrow diagram uses a few simple elements to show how project work moves from start to finish. Once we understand these parts, the full network becomes much easier to read.
1. Activities and arrows
In an Activity-on-Arrow diagram, each arrow represents a project activity. The tail marks where the work begins, while the arrowhead shows where it ends.
The activity name, ID, and duration usually appear beside the arrow. Its visual length does not represent how long the task takes.
2. Events and nodes
Nodes represent events where activities start or finish. They do not require time or resources.
A dependent activity can begin only after all required incoming activities reach the node.
3. Dependencies and paths
The direction of the arrows shows the required task sequence. Connected activities form a path from the project start to the finish.
Parallel branches show work that can happen at the same time. The longest dependent path is the critical path.
4. Dummy activities
A dummy activity shows a dependency without representing actual work. It has zero duration, uses no resources, and usually appears as a dashed arrow.
We use it only when the relationship between activities cannot be shown clearly with real activity arrows.
What are the types of arrow diagrams?
Project network diagrams are commonly represented in two formats. Understanding the difference helps us choose the right approach for planning and scheduling.
Activity-on-arrow diagrams
Activity-on-Arrow (AOA) places activities on arrows and events on nodes. It mainly represents finish-to-start dependencies and may require dummy activities to show certain relationships. This is the traditional format used in the arrow diagramming method and is commonly associated with CPM and PERT network diagrams.
Activity-on-node diagrams
Activity-on-Node (AON), also known as the Precedence Diagramming Method, places activities inside nodes and uses arrows to show dependencies. It supports multiple dependency types, avoids dummy activities in most cases, and is the format used by most modern project scheduling tools.
Factor | Activity-on-Arrow | Activity-on-Node |
Activities appear as | Arrows | Nodes |
Arrows show | Activities | Dependencies |
Dummy activities | Sometimes required | Rarely required |
Best suited for | Traditional network analysis | Modern project scheduling |
When should we use the arrow diagramming method?
We should use the arrow diagramming method when a project has several dependent activities and we need to understand their sequence before finalizing the schedule.
It is especially useful when:
- Activities have clear predecessor and successor relationships
- Some tasks can run in parallel
- We need to identify the critical path
- A delay in one task may affect later work
- The team needs a shared view of project dependencies
It works well for construction plans, software projects, product launches, process changes, and other dependency-heavy work.
For smaller projects with few dependencies, a simple task list may be enough. If the team mainly needs calendar dates, progress tracking, or multiple dependency types, a Gantt chart or Activity-on-Node diagram may be more practical.
What are the benefits of arrow diagramming?
Arrow diagramming helps us make better scheduling decisions by showing how project activities affect one another in a clear visual structure.

- Clarifies task sequence: Shows the exact order in which work must happen, helping teams understand what needs to be completed before the next step can begin.
- Maps dependencies: Makes predecessor and successor relationships easier to review, so it is clear which tasks rely on others being finished first.
- Identifies parallel work: Reveals which activities can move forward at the same time, helping improve efficiency and reduce unnecessary delays.
- Highlights the critical path: Shows the sequence of tasks that directly determines the overall project completion time, making it easier to focus on what matters most.
- Reveals scheduling risks: Makes bottlenecks, overlaps, and dependency conflicts easier to spot early, before they cause delays in execution.
- Supports realistic planning: Helps test whether the proposed schedule is achievable by checking if task durations and dependencies fit within the available timeline.
- Improves team alignment: Gives stakeholders a shared visual understanding of project logic, reducing confusion and improving coordination.
- Supports schedule changes: Shows which later tasks may be affected by a delay in earlier activities, making it easier to adjust plans when changes occur.
In a Forbes Advisor survey, 49% of respondents said ineffective communication affected their productivity, showing why project dependencies need to be visible and easy to interpret.
Arrow diagramming method example
Let's use a simple website launch project to see how the arrow diagramming method works in practice.
Activity | Task | Duration | Predecessor |
A | Confirm requirements | 2 days | None |
B | Create website structure | 3 days | A |
C | Write website content | 4 days | A |
D | Design page layouts | 5 days | B |
E | Build the website | 6 days | C and D |
F | Test and publish | 2 days | E |
The project begins with confirming requirements. Website structure and content can then move forward on separate paths. Development starts only after the content and design work are complete, followed by testing and publishing.
The longest dependent route is:
A → B → D → E → F
This is the critical path. A delay in any activity on this route can delay the website launch.
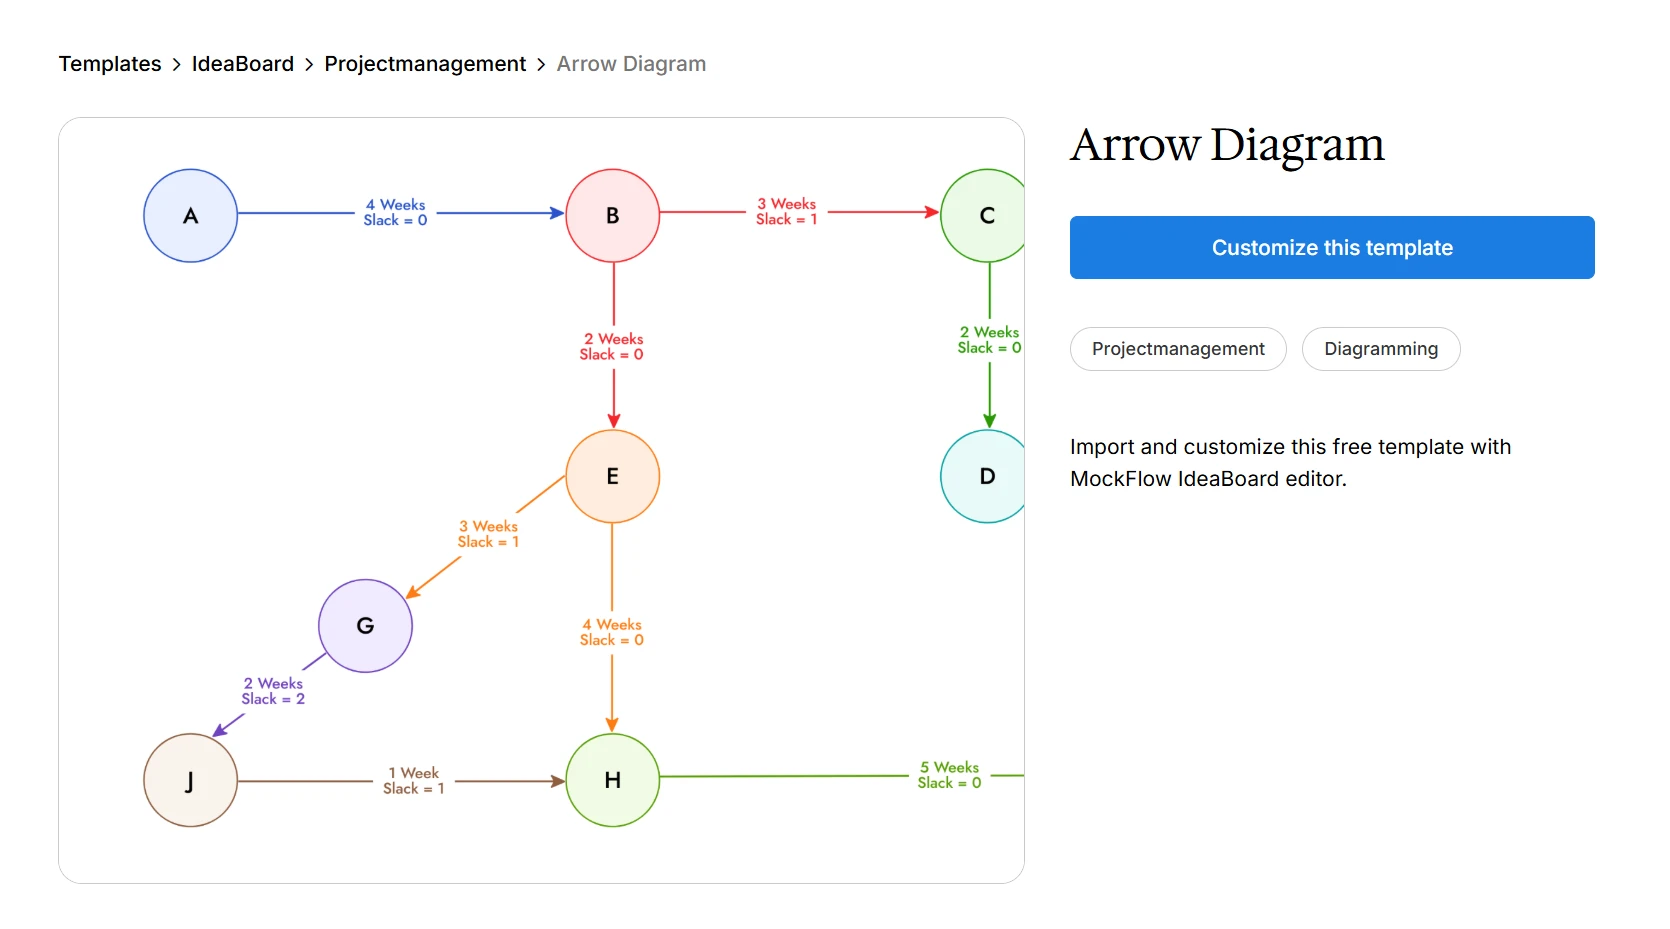
Customize this arrow diagram template in MockFlow IdeaBoard
The finished diagram gives us a quick view of task order, parallel work, merge points, and the sequence that controls the project timeline.
How to create an arrow diagram in MockFlow IdeaBoard
An arrow diagram should reflect how work actually flows through a project. Start by structuring activities and dependencies, then build the network visually and validate it with the people responsible for each task.
A shared digital workspace like IdeaBoard makes that validation easier when contributors are working across locations. An OECD survey found that 87% of respondent businesses considered digital tools beneficial for improving workplace flexibility.
The website-launch example from the previous section is a good reference point.

1. List the project activities
Create a simple table for every activity with:
- Activity ID
- Task name
- Duration
- Immediate predecessor
For the website launch:
- A: Confirm requirements, 2 days
- B: Create website structure, 3 days
- C: Write website content, 4 days
- D: Design page layouts, 5 days
- E: Build the website, 6 days
- F: Test and publish, 2 days
Keep task names short and action-based. Place this table beside the diagram so the original data remains visible while building the network.
A blank canvas is usually the easiest starting point. If you want a faster setup, begin with the IdeaBoard template library and adjust it to your project.
2. Identify activity dependencies
Define what must finish before each activity can begin.
In this example:
- B and C depend on A
- D depends on B
- E depends on C and D
- F depends on E
Separate sequential work from parallel work. After requirements (A), both structure (B) and content (C) can start independently, so they form two branches.
Next, identify merge points. Development (E) cannot begin until both content and design are ready, so the branches must reconnect before E.
Always confirm dependencies with task owners before drawing the final network. Even a small error here can distort the critical path and overall timeline.
3. Generate a starting structure from project notes
Many projects already contain useful input in scope documents, meeting notes, briefs, or requirement files.
Instead of manually extracting everything, use Mida AI to convert source material into a structured visual board. It can generate an initial set of activities, durations, and relationships that you can refine into an arrow diagram.
Treat this as a draft only. Validate every task, duration, and dependency against the approved plan before finalizing the network.
4. Add the starting event
Open a board in MockFlow IdeaBoard and place a circular node on the left side of the canvas.
Label it Start or assign the first event number.
Keep enough horizontal space for the full sequence and vertical space for parallel branches. A consistent left-to-right flow improves readability as the diagram grows.
5. Draw activities as arrows
Start from the initial event and draw the first arrow:
A: Confirm requirements, 2 days
Add an event node at the end of the arrow.
From there, split into two branches:
- B: Create website structure, 3 days
- C: Write website content, 4 days
Continue the structure path:
D: Design page layouts, 5 days
Then merge both paths before development:
E: Build the website, 6 days
Finish with:
F: Test and publish, 2 days
Add a final node labeled Finish.
Keep labels consistent across all activities. Maintain a single direction of flow and even spacing so the diagram remains readable without relying on color.
6. Use the AI Prompt Box for repeatable setup
For teams that create arrow diagrams frequently, add an AI Prompt Box with a reusable workflow to the board.
Configure it to extract:
- Project activities
- Activity IDs
- Durations
- Immediate predecessors
- Parallel workstreams
- Merge points
A simple instruction could be:
“Review the project description and return a table containing each activity, its duration, and its immediate predecessor. Identify tasks that can run in parallel and points where multiple paths must merge.”
This does not replace validation. It only provides a structured starting point before drawing the network.
If reused across projects, save it as an AI Recipe so the same workflow can be applied without rebuilding prompts each time.
7. Add events and dummy activities
Place an event node at every start or end of an activity.
Before drawing outgoing arrows, ensure all required incoming activities are complete at that node, especially where branches merge.
Use a dashed dummy arrow only when a dependency cannot be represented through real activities.
A dummy activity should:
- Have zero duration
- Use no resources
- Represent no actual work
- Exist only to preserve correct logic
Avoid adding dummy activities just for visual balance.
After building the network, trace every path from Start to Finish. Check for missing links, incorrect dependencies, duplicate relationships, or early merge points.
8. Identify the critical path
Add durations along each full route.
For the website launch:
- A → B → D → E → F = 18 days
- A → C → E → F = 14 days
The longest path is:
A → B → D → E → F
This is the critical path. Highlight it clearly using a distinct color or thicker line.
Any delay on this path directly impacts the project completion date. The shorter content path may offer limited flexibility, but only within the constraints of when development requires final inputs.
IdeaBoard supports the visual construction, but the critical path must always be calculated from confirmed durations, not assumed from layout.
9. Review the diagram with activity owners
Review the completed network with owners of requirements, structure, content, design, development, and testing.
Confirm:
- All required activities are included
- Durations are realistic
- Dependencies reflect actual workflow
- Parallel work can truly happen simultaneously
- Merge points are correct
- Critical path is accurate
Attach feedback directly to relevant nodes or arrows. For simple notes, text comments are enough. For deeper clarification, use voice or video comments on the board to keep context clear.
This ensures feedback stays tied to the exact part of the diagram it refers to.
10. Share the approved network
Once the sequence and dependencies are confirmed, share the IdeaBoard with the project team for final alignment.
The approved arrow diagram should clearly show:
- What starts first
- What runs in parallel
- Where paths merge
- Which sequence defines the project timeline
A well-structured network at this stage becomes the foundation for scheduling, tracking delays, and managing execution as the project progresses.
Conclusion
A well-built arrow diagram makes project planning easier by showing task sequence, dependencies, parallel work, and the critical path in one visual view. Instead of relying on scattered task lists, you can review the entire workflow before execution and spot potential scheduling risks early.
Ready to create your own? Sign up and start with MockFlow IdeaBoard to build and collaborate on arrow diagrams visually, or use the free Online Whiteboard for quick planning sessions before moving to a detailed project schedule.
Frequently asked questions
1. Is the arrow diagramming method still used in project management?
Yes. It remains useful for dependency mapping, network analysis, and critical-path planning. However, many modern scheduling tools use Activity-on-Node diagrams because they support more dependency types and are easier to update as schedules change.
2. Is the arrow diagramming method the same as the Critical Path Method?
No. The arrow diagramming method shows activities and dependencies visually. The Critical Path Method uses activity durations to calculate the longest dependent path and the minimum time needed to complete the project.
3. Can an arrow diagram show tasks happening at the same time?
Yes. Parallel branches represent activities that can begin after the same event and proceed simultaneously. They reconnect when a later activity depends on the completion of both branches.
4. Do all Activity-on-Arrow diagrams need dummy activities?
No. Dummy activities are only needed when a dependency cannot be represented accurately with actual activity arrows. They have zero duration and should be added only when they clarify the network logic.
5. How are activity durations shown in an arrow diagram?
The duration is usually written beside the activity arrow, along with the task name or ID. The physical length of the arrow does not indicate how long the activity takes.
6. Can arrow diagrams be used with a Gantt chart?
Yes. Use the arrow diagram to confirm task sequence, dependencies, and the critical path. Then transfer the approved activities into a Gantt chart to assign calendar dates, resources, and progress updates.
Affinity Diagram: A Practical Guide to Organizing Ideas and Insights
Introduction Brainstorming sessions often produce dozens of ideas in minutes, but it gets difficult to figure out which ideas...

How to Make a Storyboard? A Step-by-Step Guide for 2026
TL;DR A storyboard is a visual plan that breaks a story, video, animation, scene, or user journey into ordered frames. To...

Wireframe Presentation: How to Present Wireframes to Clients & Stakeholders
A wireframe can be clear on the designer’s screen and still fall apart in a client review. Stakeholders may focus on unfinished...
